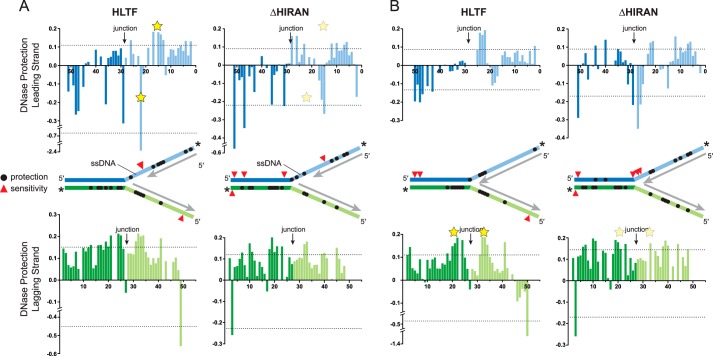
Figure 4.
DNase footprint of HLTF bound to model forks. A and B, quantitation of HLTF (WT and ΔHIRAN mutant) footprinting on gapped (A) and nongapped (B) fork substrates. Bar graphs plot the amount of nuclease protection (positive value) or sensitivity (negative value) as a function of nucleotide position relative to the fluorescein label along the leading (blue) or lagging (green) strand. Dashed lines signify 0.5 S.D. from the mean protection/sensitivity. Yellow stars indicate significant differences in protection between HLTF and ΔHIRAN in each fork. The location of significant protection and sensitivity sites are shown as black circles and red triangles, respectively, on the schematic diagrams. Asterisks indicate the position of the fluorescein labels on each strand, and unlabeled nascent strands are shown in gray. Representative footprinting gels are shown in Fig. S2.

