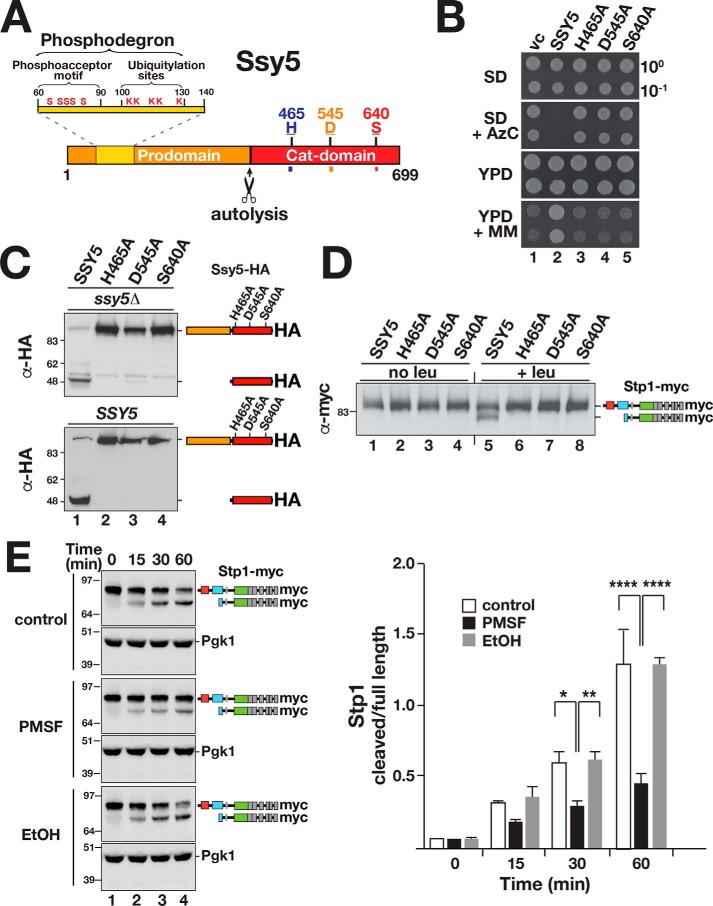
Figure 1.
Ssy5 is a serine protease that undergoes autolytic processing. A, schematic diagram of the Ssy5. Scissors indicate the autolytic cleavage site. The prodomain (residues 1–381) includes a phosphodegron (residues 60–130) containing the phosphoacceptor motif (conserved serine residues and ubiquitylation sites, Ser and Lys, respectively) (22). The Cat domain (residues 382–699) presents a chymotrypsin-like catalytic triad composed of residues His-465, Asp-545, and the nucleophilic Ser-640. B, growth of ssy5Δ strain CAY265 transformed with pRS316 (vc), pCA177 (SSY5), pCA215 (ssy5-His-465A), pCA216 (ssy5-Asp-545A), or pCA217 (ssy5-Ser-640A). Dilutions of cultures grown in SD were spotted onto SD, SD+AzC, YPD, and YPD+MM, and the plates were incubated at 30 °C. C, autolytic processing of Ssy5 requires a functional catalytic triad. Immunoblot analysis of extracts prepared from HKY77 (ssy5Δ; upper panel) and CAY29 (SSY5; lower panel) carrying pCA177 (SSY5), pCA215 (ssy5-His-465A), pCA216 (ssy5-Asp-545A), or pCA217 (ssy5-Ser-640A). Cells were grown in SD in the absence of inducing amino acids. The immunoreactive forms of the HA-tagged constructs are schematically depicted at their corresponding positions of migration. D, Stp1 cleavage by Ssy5 requires a functional catalytic triad. Immunoblot analysis of protein extracts from HKY77 (ssy5Δ) carrying plasmids as in C grown in SD (no leu) and 30 min after the induction by leucine (+leu). The immunoreactive forms of Stp1 are schematically depicted. E, serine protease inhibitor PMSF inhibits Ssy5. Immunoblot analysis of in vitro Stp1 cleavage reactions. Lysates of strain AMY001 (ssy5Δstp1Δstp2Δprb1Δ) carrying pCA177 (Ssy5-HA) were prepared 30 min after induction with 1.3 mm leucine and mixed with lysates of AMY001 expressing Stp1-myc (pCA211) in the absence or presence of either 5 mm PMSF or an equal volume of ethanol 99.5% (EtOH). The immunoreactive forms of myc-tagged Stp1 are schematically represented at their corresponding positions of migration (left panel). The signal intensities of the cleaved and full-length forms of Stp1 were normalized to loading control Pgk1 (α-Pgk1 antibody) and quantified. The ratios between the values of cleaved and full-length forms of Stp1 were determined at the different time points and the mean values plotted (right panel). Error bars show standard deviation (n = 3). Two-way ANOVA followed by Tukey's multiple comparison test was performed using GraphPad Prism version 7.0. Significance values are indicated by the following: *, p = 0.013; **, p = 0.005; ****, p < 0.001. Molecular markers (kDa) are indicated at the position of migration (left of immunoblots).

