Figure 3.
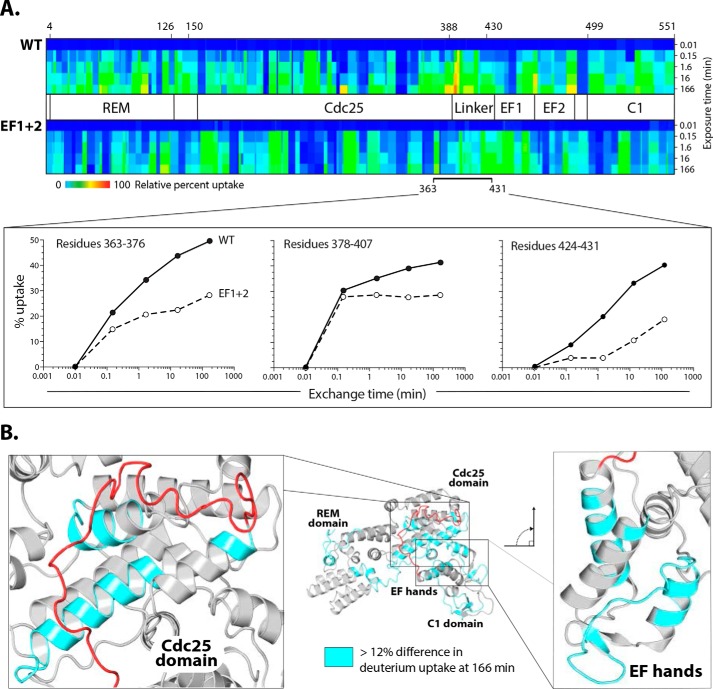
Differential hydrogen–deuterium exchange between CalDAG-GEFI WT and EF1+2. A, Heat maps of deuterium uptake for CalDAG-GEFI and EF1+2. Proteins were incubated in deuterated water for the indicated times prior to measurements of deuterium uptake using MS. The largest differences in uptake between the two proteins span the putative autoinhibitory linker and EF hands. Heat maps for individual peptides in the linker region are shown below. B, homology model of CalDAG-GEFI. Light blue map enhanced deuterium uptake (>12%, excluding the linker) of CalDAG-GEFI relative to EF1+2. The majority of these regions cluster within the binding site for Rap1B and EF hands shown in expanded views.

