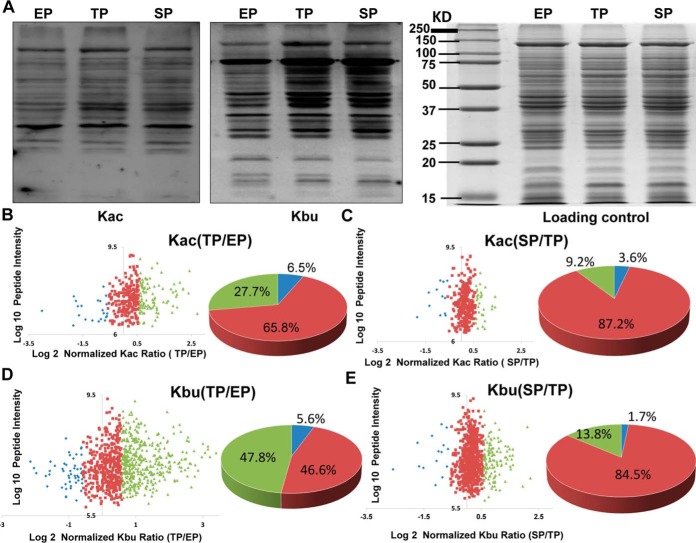
Fig. 1.
Quantitative analysis of lysine acetylome and butyrylome in three growth phases in C. acetobutylicum strain. A, Western blot analysis of the global lysing acetyllysine and butyryllysine level in protein lysates from C. acetobutylicum strain in the exponential phase (EP), transitional phase (TP), and stationary phase (SP). Coomassie blue staining was used as the loading control. B, Scatter plot of the quantifiable lysine acetylation sites identified in the EP and TP of the C. acetobutylicum strain. Log2 of the normalized TP/EP (M/L) ratios of the quantifiable sites were used for X axis and log10 of total intensities for each acetylated peptide for Y axis. Blue dots represent the sites of normalized M/L ratio less than 0.67; Red dots represent the sites of normalized M/L ratio between 0.67 and 1.5; Green dots represent the sites of normalized M/L ratio higher than 1.5. The percentage of acetylated sites in different M/L ratio ranges were presented in the pie chart. C, Scatter plot of the quantifiable lysine acetylation sites identified in the TP and SP of the C. acetobutylicum strain. Log2 of the normalized SP/TP (H/M) ratios of the quantifiable sites were used for X axis and log10 of total intensities for each acetylated peptide for Y axis. Blue dots represent the sites of normalized H/M ratio less than 0.67; Red dots represent the sites of normalized H/M ratio between 0.67 and 1.5; Green dots represent the sites of normalized H/M ratio higher than 1.5. The percentage of acetylated sites in different H/M ratio ranges were presented in the pie chart. D, Scatter plot of the quantifiable lysine butyrylation sites identified in the EP and TP of the C. acetobutylicum strain. Annotation is same in Fig. 1B. E, Scatter plot of the quantifiable lysine butyrylation sites identified in the TP and SP of the C. acetobutylicum strain. Annotation is same in Fig. 1C.

