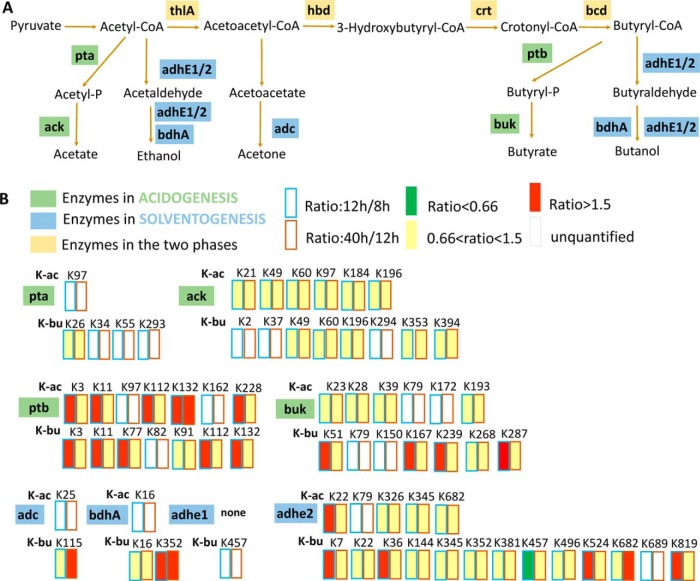
Fig. 4.
The acylated states of the enzymes in the acid/solvent pathway. A, Diagram showing the metabolic enzymes involved in acidogenesis or solventogenesis. Enzymes in acidogenesis were shown in green; enzymes in solventogenesis were shown in blue; Enzymes in both the two phases were shown in yellow. B, The quantitative acylation level of pta, ack, ptb and buk in the acid formation pathway and adc, bdhA, adhe1 and adhe2 in the bioalcohol formation pathway.

