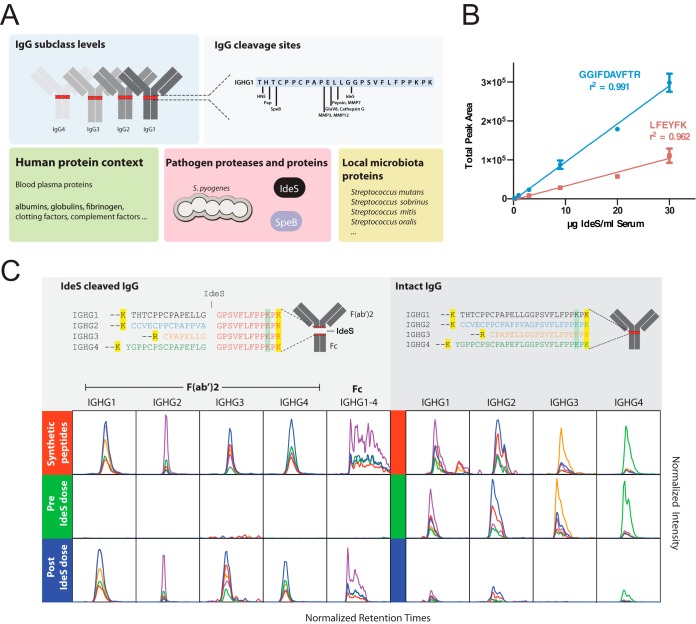
Fig. 1.
Development of SRM assays targeting the proteolytic activity of IdeS on IgG. A, Overview of targeted protein types used for the development of a quantitative SRM assays method to quantify the degree of proteolytic processing of IgG. The SRM method includes all potential IgG peptides produced by the targeted proteases in combination with trypsin. Measuring species-specific pathogen peptides requires knowledge of peptide selectivity and sensitivity across relevant taxa. B, Six samples of IdeS at different concentrations in two different human serum backgrounds were prepared by serial dilution to generate a calibration curve spanning a concentration range of 0.25 μg to 30 μg IdeS per ml human serum. The plot shows the total area over the dilution range of indicated SRM targeted peptides derived from IdeS and their respective correlation coefficients (r2). The data represents average total area ± S.D. of the two different serum backgrounds. C, IdeS cleavage of IgG results in the formation of Fc and F(ab)2 fragments. Tryptic peptides derived from intact IgG or IdeS-cleaved IgG in the lower hinge region spanning the IdeS specific cleavage site in all four subclass heavy chains (UniProt accession entry/residue positions): IGHG1_HUMAN/104–137, IGHG2_HUMAN/101–134, IGHG3_HUMAN/158–185 and IGHG4_HUMAN/101–135) are shown in the upper panels. Yellow or green marked residues indicate a C-terminal trypsin cleavage site or a low probability C-terminal trypsin cleavage site, respectively. The peptide text color indicates the subclass selectivity: black IGHG1, blue IGHG2, orange IGHG3, green IGHG4, redIGHG1–4. Based on synthetic variants of these peptides, SRM assays were developed. In the lower panels are comparisons of the SRM traces from the synthetic peptides (red) and human serum pre- (green) and post- (blue) intravenous administration of IdeS. The x axis shows the normalized peptide retention times (iRT score). The y axis's ranges are fixed between pre- and post-IdeS doses to show level of change. The line colors represent different product ions depending on the peptide precursor.

