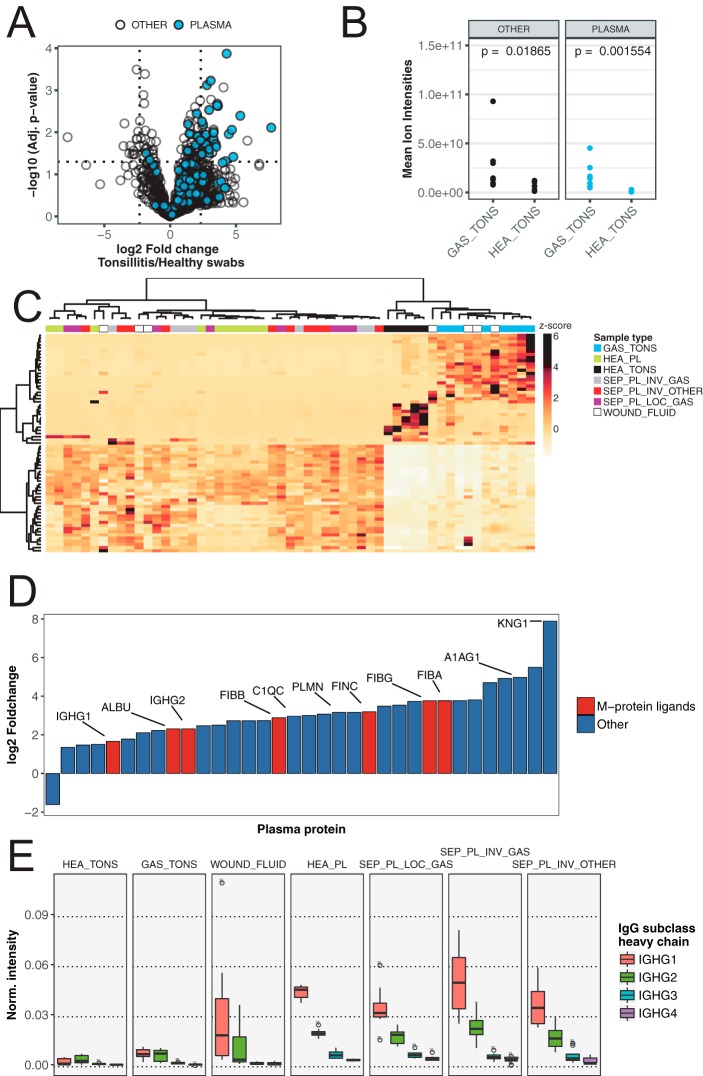
Fig. 4.
Differential abundance of IgG and other blood plasma proteins across patient and control samples. A, Differential protein abundance volcano plots of samples from tonsillar surfaces of S. pyogenes pharyngitis patients and healthy controls. Blue filled circles are blood plasma proteins. Dotted lines indicate significance and fold change thresholds (vertically respectively horizontally). Multiple testing corrections were performed by the Benjamini-Hochberg method. B, Comparison of mean total protein abundance (sum of all protein ion intensities) of tonsil swabs from patients with S. pyogenes pharyngitis (GAS_TONS) and healthy controls (HEA_TONS) showing plasma proteins (same as in A)) and other proteins. The p values were calculated with nonpaired Wilcoxon rank sum test. C, Hierarchical clustering of all patient samples with the subset of proteins that show significantly different abundance on healthy or S. pyogenes pharyngitis surfaces (Top left and right quadrants in Fig. 4A). D, Relative fold-change of plasma proteins with the significantly largest abundance difference between healthy and S. pyogenes pharyngitis surfaces (Top left and right quadrants in Fig. 4A). Plasma proteins with known binding to S. pyogenes M protein are filled with red, and others with blue. Lines and Uniprot Entry name highlight selected proteins with the common suffix “_HUMAN” removed. E, Normalized intensities (fraction of total signal) of IgG heavy chain subclasses across sample groups. Boxes represent 25th to 75th % quantiles, middle represents median, and lines smallest and largest observations.

