Fig. 3.
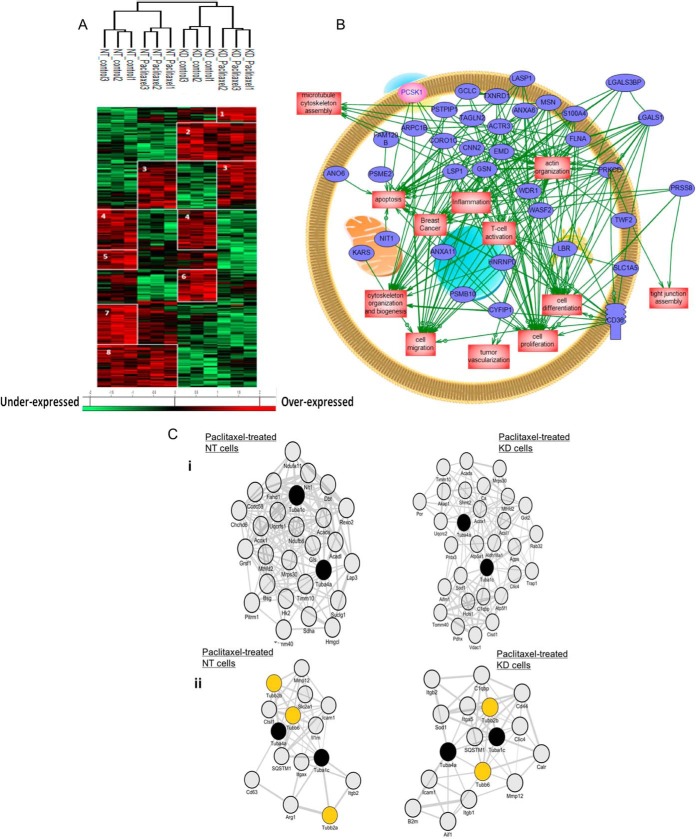
PC1/3 KD macrophages express intracellular proteins related to macrophages immune functions. A, NR8383 cells were stimulated with Paclitaxel (30 μm) or not (control) and lysed before FASP and LC-MS/MS analysis. MaxQuant and Perseus software were used for the statistical analysis, and a heat map was generated to show proteins that were significantly different between NT and PC1/3-KD NR8383 macrophages stimulated or not with Paclitaxel in the cell extracts. Eight clusters are highlighted. B, Global pathway analysis of the overexpressed proteins specifically identified in PC1/3-KD cells. The relationship between the overexpressed proteins with PCSk1/3 (pink) is also showed. C, Co-expression network analyses. i) Co-expression of Tuba1c/Tuba4a with mitochondria-related molecules in Paclitaxel-treated NT versus Paclitaxel-treated KD cells. The 100 genes which encoded molecules were the most tightly coexpressed with Tuba4a/Tuba1c were identified in Paclitaxel-treated NT versus Paclitaxel-treated KD cells. Shown are subnetworks of genes annotated by the GO term “mitochondrion” (adjusted p value for enrichment significance = 0.11e-3 in Paclitaxel-treated NT cells and 0.10e-5 in Paclitaxel-treated KD cells). ii) Co-expression of tubulins with immune-related molecules in Paclitaxel-treated NT versus Paclitaxel-treated KD cells. The 100 genes which encoded molecules were the most tightly coexpressed with Tuba4a/Tuba1c were identified in Paclitaxel-treated NT versus Paclitaxel-treated KD cells. Shown are subnetworks of immune-related genes.

