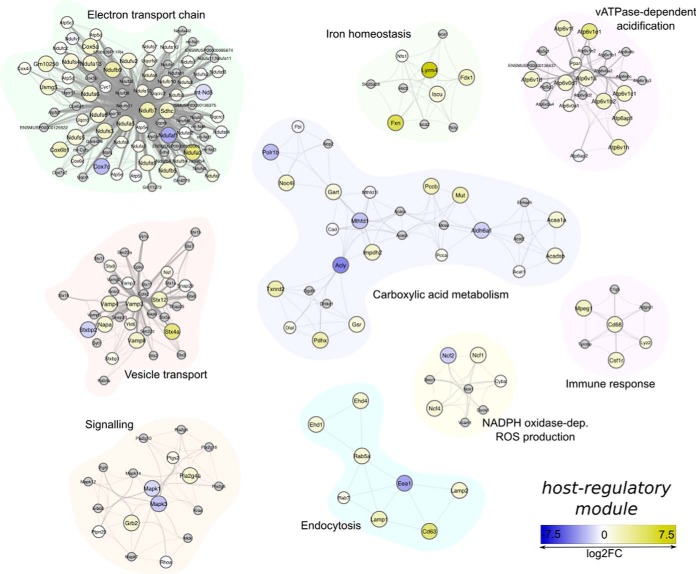
Fig. 3.
Host regulatory module. A total of 302 proteins are connected by 3448 edges in the displayed module. 178 proteins were detected in the LC-MS/MS analysis and 109 classified as differentially regulated. The graph displays regions of the protein-protein interactome that are significantly enriched and shown here to be differently regulated. The color scale from blue to yellow represents the log2 fold change of protein abundances, proteins in gray were not detected by mass spectrometry, but complete the respective submodule because of their close connectivity to the neighboring partner. The edge size is indicative of the confidence score of the interaction.

