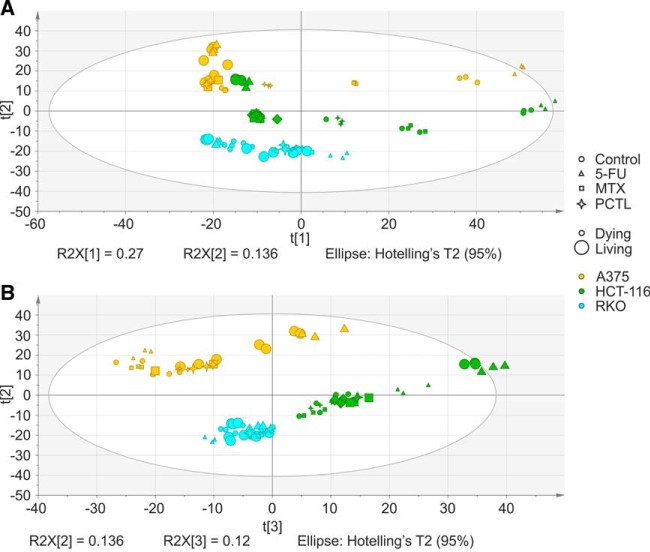
Fig. 1.
Principal component analysis of the whole proteome data set (Q2 = 0.705). A, The first principal component separated dying (detached) versus living (attached) cells, whereas the second component separated the cell lines. B, The third component seems to separate the different states based on carbohydrate metabolic states such as galactose, fructose, mannose and glutathione metabolism.

