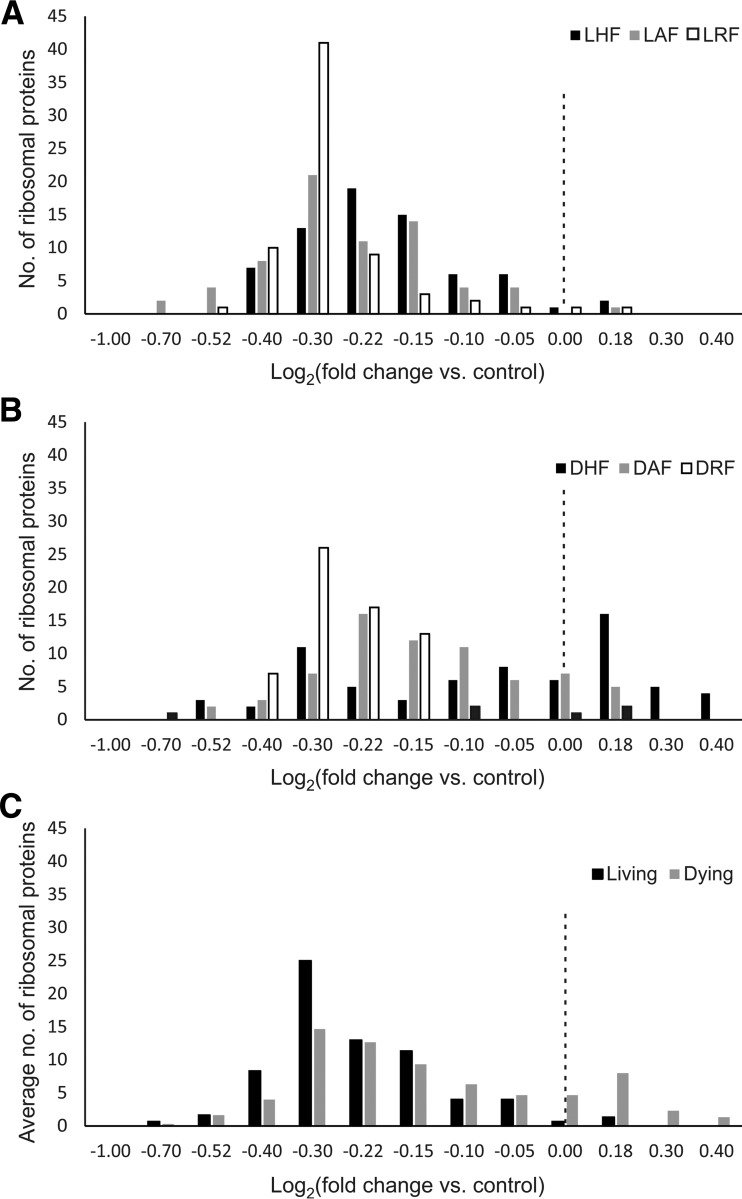
Fig. 3.
Significant downregulation of ribosomal proteins upon 5-FU treatment in living cells compared with dying cells. A, The regulation frequency of ribosomal subunits in response to 5-FU in living cells and B, in dying cells. C, The average frequency of ribosomal subunits regulation in all three living cell lines versus dying ones. The dashed line represents a regulation of 1 fold (L = living, D = dying, H = HCT116 cells, A = A375 cells, R = RKO cells, F = 5-FU, M = methotrexate and P = paclitaxel).

