. 2018 May 14;7:e34077. doi: 10.7554/eLife.34077

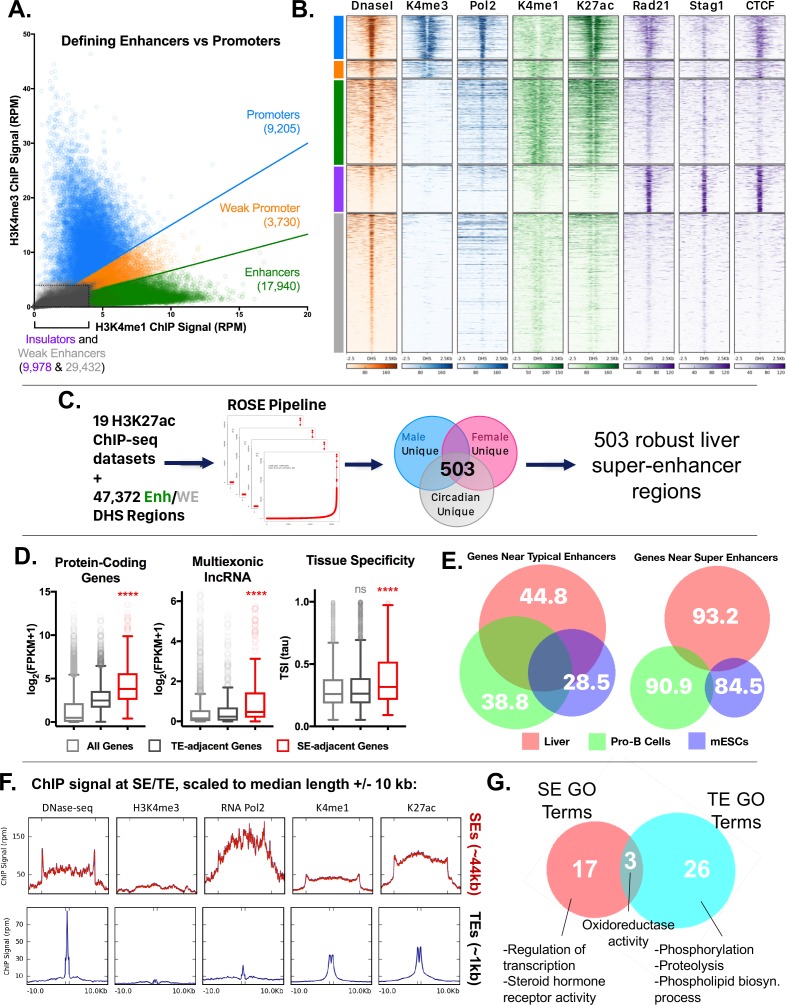
Figure 4. Categorization of DHS-based regulatory elements in mouse liver.

(A) Classification of set of ~70,000 open chromatin regions (DHS) identified in adult male mouse liver, based on relative intensities for a combination of H3K4me1 and H3K4me3 marks, and CTCF ChIP-seq data. Based on the combinatorial signal from these three datasets, five groups of DHS were identified: promoter-DHS, weak promoter-DHS, enhancer-DHS, weak enhancer-DHS, and insulator-DHS, as described in Materials and methods and in Figure 4—figure supplement 1A. (B) Shown is a heatmap representation of the simplified five-class DHS model shown in panel A, which captures features such as CNC enrichment at enhancers and K27ac enrichment at enhancers and promoters, with additional features described in Figure 4—figure supplement 1A. Color bar at the left matches colors used in panel A. (C) Scheme for using 19 published mouse liver H3K27ac ChIP-seq datasets to identify a core set of 503 liver super-enhancers using the ROSE software package (Supplementary file 2B). These 503 super-enhancers were identified in all 19 samples, indicating they are active in both male and female liver, and across multiple circadian time points. Enh, enhancer, WE, weak enhancer. (D) Genes associated with super-enhancers (SE) are more highly expressed (log2(FPKM +1) values) than genes associated with typical enhancers (TE), for both protein coding genes and liver-expressed multi-exonic lncRNA genes. The super-enhancer-adjacent genes are also more tissue specific (higher Tau score) than typical enhancer-adjacent genes. ****, KS t-test, p<0.0001 for pairwise comparisons of SE-adjacent genes vs. TE-adjacent genes. (E) Venn diagrams show substantial overlap between typical enhancer gene targets across tissues (liver, ESCs, ProB cells), but limited overlap between super-enhancer adjacent genes (within 10 kb of the super-enhancer) for the same tissues. The numbers represent the percent of genes targeted in a given tissue by the indicated class of enhancer (typical enhancers or super-enhancers) that are not targets of the corresponding class of enhancers in the other two tissues. For example, 93.2% of genes targeted by liver super-enhancers are not targeted by the set of super-enhancers identified in either Pro-B or mouse ESCs. Gene targets of each enhancer class were identified by GREAT using default parameters, then filtered to keep only those ≤10 kb from the enhancer. (F) ChIP and DNase-seq signal at typical enhancers and super-enhancers, scaled to their median length (1 kb and 44 kb respectively; indicated by distance between hash marks along the x-axis) flanked by 10 kb up- and down-stream. Super-enhancers show much greater accumulation of RNA polymerase 2, despite little or no apparent enrichment for the promoter mark H3K4me3. (G) Super-enhancers (SE) target distinct categories of genes than typical enhancers (TE) in mouse liver. Thus, while GO terms such as oxidoreductase activity are enriched in the set of gene targets for both classes of enhancers, only super-enhancers are enriched for transcription-regulated terms (e.g., Regulation of transcription, Steroid hormone receptor activity) (Supplementary file 2C,D). Numbers represent the overlap of GO terms (either Molecular Function or Biological Process) in any DAVID annotation cluster (with an enrichment score >1.3) enriched for genes regulated by either typical enhancers or super-enhancers.

Figure 4.

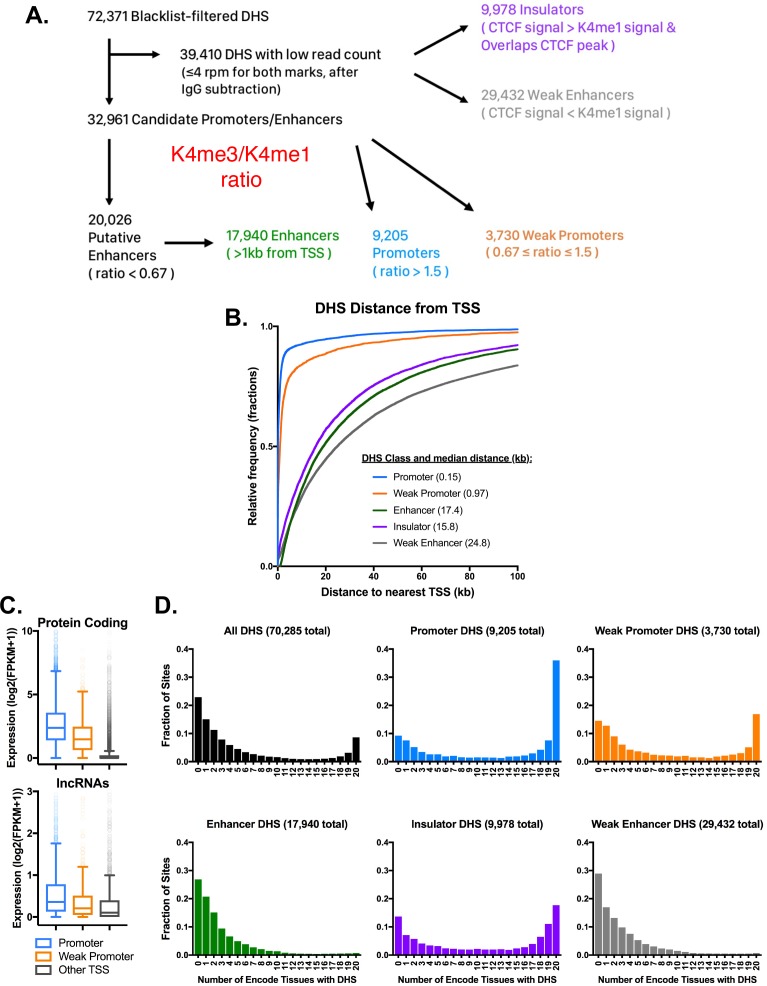
Figure 4—figure supplement 1. Characteristics of five classes of DHS in mouse liver.

Figure 4—figure supplement 1.

(A) Schematic for the classification of open chromatin regions (DHS) in mouse liver based on their H3K4me1, H3K4me3, and CTCF ChIP-seq signals. DHS with >4 rpm for either H3K4me3 or H3K4me1 were classified based on the ratio of H3K4me3 to H3K4me1 signal, where a high ratio indicates a promoter-like DHS, and a low ratio indicates an enhancer-like DHS regions. For the 39,410 liver DHS with low signal for both histone marks, the H3K4me1 signal was compared to the CTCF signal to classify each DHS. Regions with higher CTCF signal that overlapped a CTCF peak were classified as Insulator-DHS and the remaining group were classified as weak enhancer-DHS (also see Supplementary file 2A). (B) The distance from each of the five DHS classes to the nearest RefSeq TSS. Regions with roughly equal H3K4me3 and H3K4me1 signal were classified as weak promoters based on their proximity to DHS. Similarly, the low signal group (in gray) were classified as weak enhancers based on distance from TSS and low signal for both DNase-seq and H3K4me1 ChIP. (C) Protein coding and lncRNA genes associated with promoter-DHS are both more highly expressed than genes associated with weak promoter-DHS or other TSS without a nearby promoter or weak promoter DHS. All groups are significantly different from one another, (KS test; p<0.001). (D) Tissue specificity of DHS identified in mouse liver. Shown is the fraction of liver DHS that overlap DHS identified in the indicated number of other mouse tissues. Insulator DHS are unique among distal DHS for having a subset that is tissue ubiquitous. Both promoter classes show a significant fraction of sites that are open across all mouse tissues, while the two enhancer classes are much more tissue specific. A value of 0 indicates that the DHS is liver specific, while a value of 20 indicates that it is found in all 20 mouse tissues.
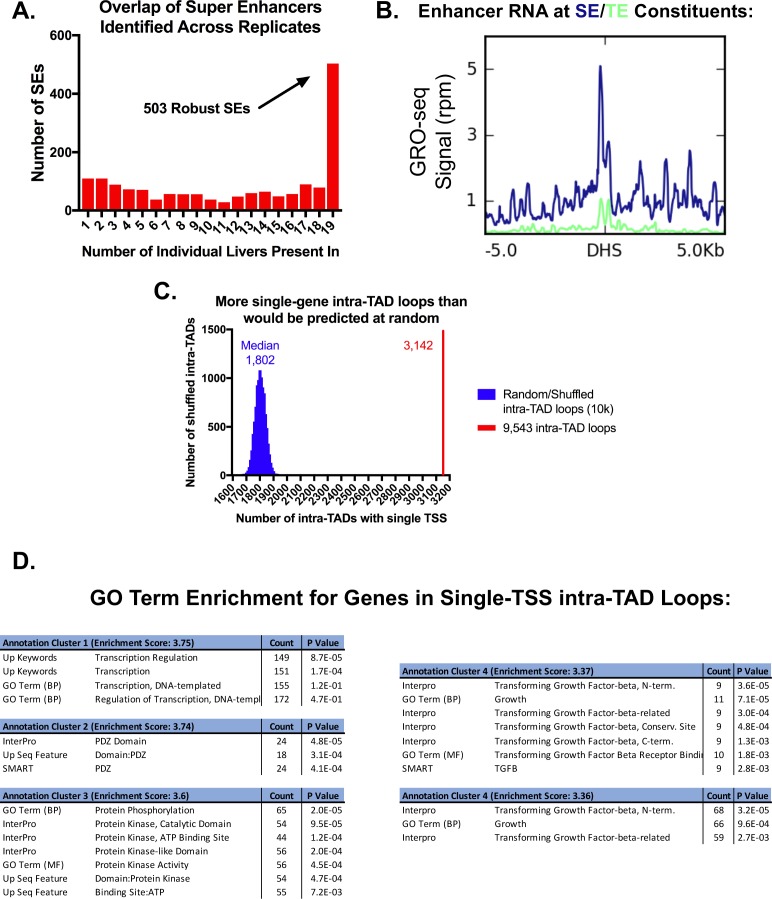
Figure 4—figure supplement 2. Features of super-enhancers and single-TSS intra-TAD loops.

Figure 4—figure supplement 2.

(A) Shown is the overlap of super-enhancers (SE) for all 19 liver H3K27ac ChIP-seq replicates (see Materials and methods). 503 of the super-enhancers were identified in all 19 liver samples, and are termed core (robust) super-enhancers. The x-axis indicates the number of liver samples in which an enhancer cluster exceeded the threshold to be identified as a super-enhancer. (B) Super-enhancer constituents show higher levels of eRNA production than typical enhancers. This is consistent with Figure 4F, which shows greater accumulation of Pol2 but not H3K4me3 than at typical enhancers, suggesting non-promoter transcription. (C) Of the 9543 intra-TAD loops, 3142 (33%) contain a single TSS. This is a higher frequency of single TSS intra-TAD loops than is expected by random chance (expected (median) = 1802 intra-TAD loops across 10,000 shuffled sets). The matched set represents a random list of genomic coordinates of the same size and number. (D) For the set of genes that are in single TSS intra-TAD loops, gene ontology analysis followed by functional annotation clustering revealed an enrichment for transcriptional regulation and kinase activity. Functional annotation clustering was performed using DAVID with high stringency for cluster assignment, but otherwise default parameters.