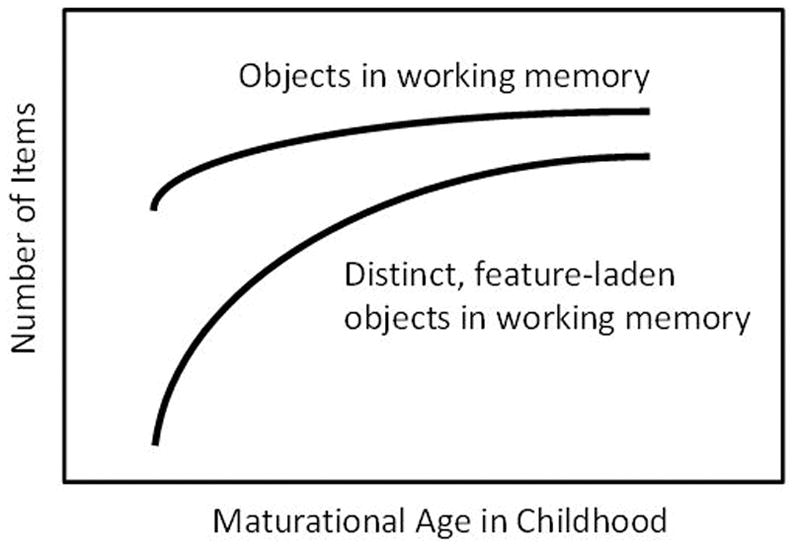
Figure 2.

A schematic diagram of how we might obtain different rates of development for different procedures. The number of objects in working memory (top line) might be larger than the number of distinct, feature-laden objects that can be discriminated from one another. In-between curves might also exist, for partly-distinguished objects.
