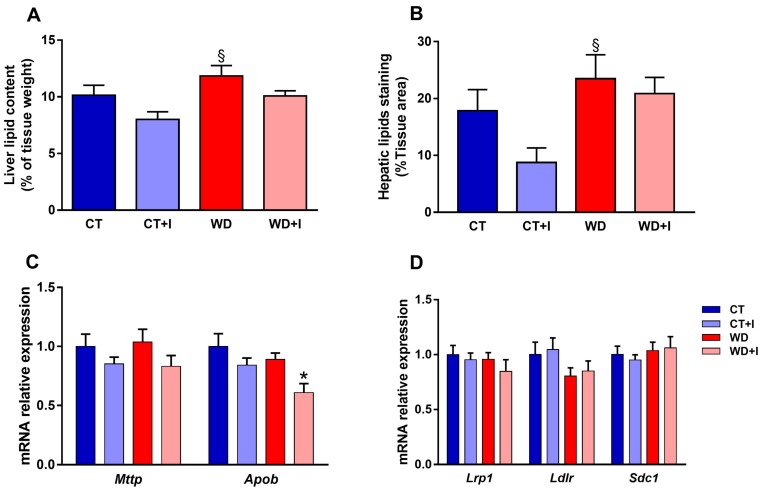
Figure 6.
Liver lipid content (A). Quantification of hepatic lipid staining with oil red O (B). Level of mRNA expression of Mttp and Apob, involved in VLDL synthesis in the liver (C). Level of mRNA expression of remnant receptors Lrp1, Ldlr and Sdc1 in the liver (D). Data are presented as mean ± SEM and analyzed with two-way ANOVA followed by Tukey post hoc tests. * p < 0.05 versus CT, § p < 0.05 versus CT + I.

