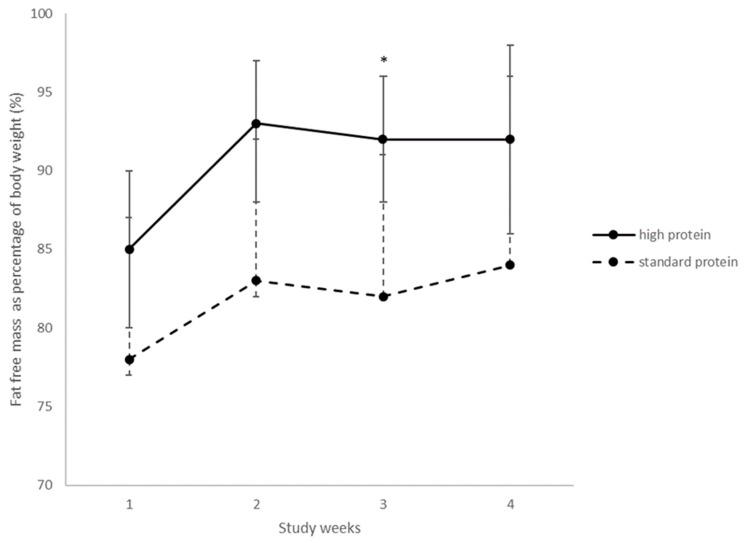
Figure 2.
Fat free mass as a proportion of body weight for the first four weeks of the trial. Values are means, error bars are 95% CI. High protein n = 30, 30, 27, 26 and standard protein 29, 27, 26, 23 in weeks 1, 2, 3, 4 respectively. Adjusted for sex and gestational age, group interaction, p = 0.03, time interaction, p = 0.01. group × time interaction p = 0.84; * p = 0.04.

