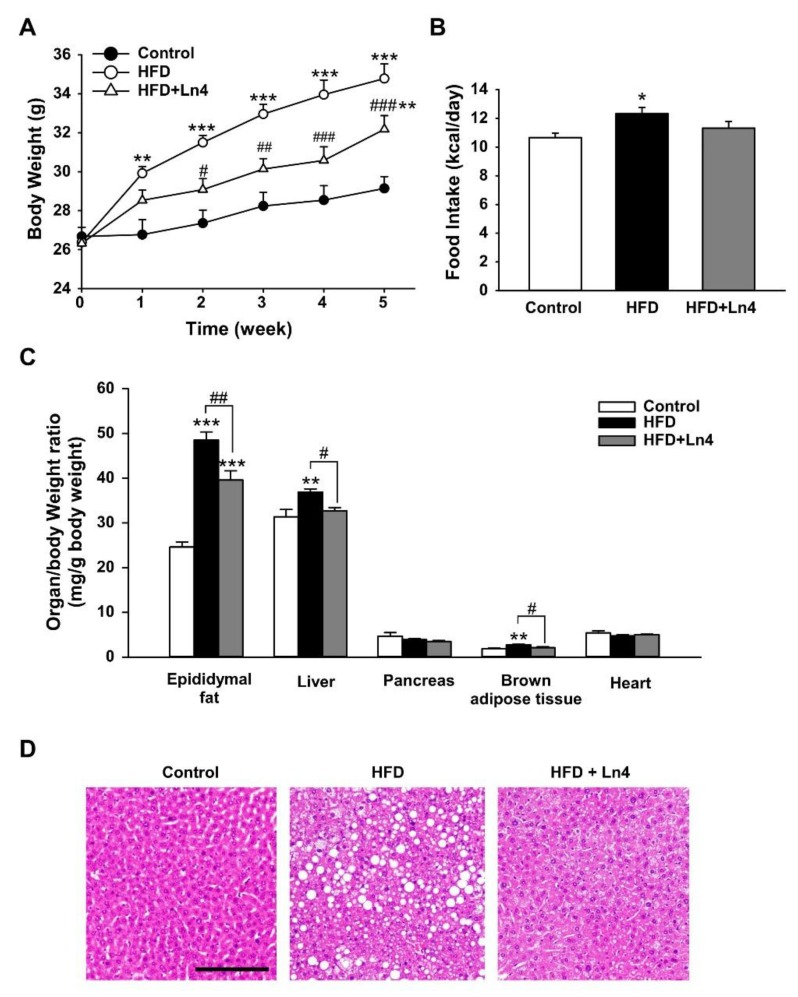
Figure 2.
Oral administration of Ln4 reduces high-fat diet-induced weight gain and organ weights in mice. (A) Body weight was measured weekly and presented as mean ± SEM (n = 5–7). The statistical significance was analyzed by Tukey’s test after two-way repeated measures ANOVA (**, p < 0.01; ***, p < 0.001 vs. Control and #, p < 0.05; ##, p < 0.01; ###, p < 0.001 vs. HFD). (B) The averaged food intake of each group was calculated and shown as mean ± SEM. The asterisks mean the statistical significance with Control group (*, p < 0.05). (C) The tissues were weighed and normalized by the body weight of each mouse. Each graph show mean ± SEM. A probability value was marked as asterisks (**, p < 0.01; ***, p < 0.001 vs. Control) or # (#, p < 0.05; ##, p < 0.01 vs. HFD) analyzed using Tukey’s test after one-way ANOVA. (D) Histochemical staining of liver from mice. The morphological changes and the lipid accumulations in the liver were performed by H&E staining. Representative pictures were taken from 5–7 independent tissue samples in each group (×200 magnification). Scale bar, 100 μm.

