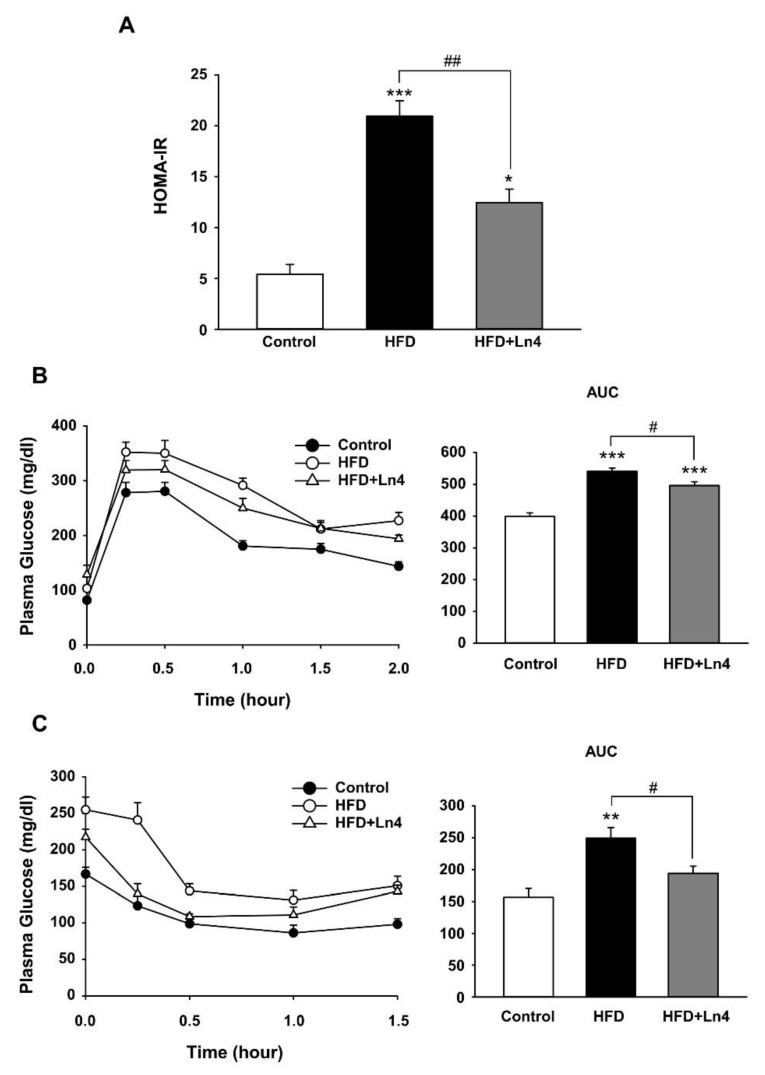
Figure 4.
Effects of Ln4 supplementation on the homeostatic model assessment (HOMA) of insulin resistance (HOMA-IR), glucose tolerance (GTT), and insulin tolerance (ITT) in mice. (A) Averaged HOMA-IR index in each group. (B) Oral glucose tolerance test was performed in mice fasted overnight. Area under curve (AUC, right) is presented by bar graph (mean ± SEM) (C) Insulin tolerance test was conducted in 5-h fasted mice by measuring plasma glucose levels during i.p. insulin. AUC (right) is presented as mean ± SEM. Statistical significance was analyzed using one-way ANOVA followed by Tukey’s test and is shown with asterisks (*, p < 0.05; **, p < 0.01; ***, p < 0.001 vs. Control) or # (#, p < 0.05; ##, p < 0.01 vs. HFD).

