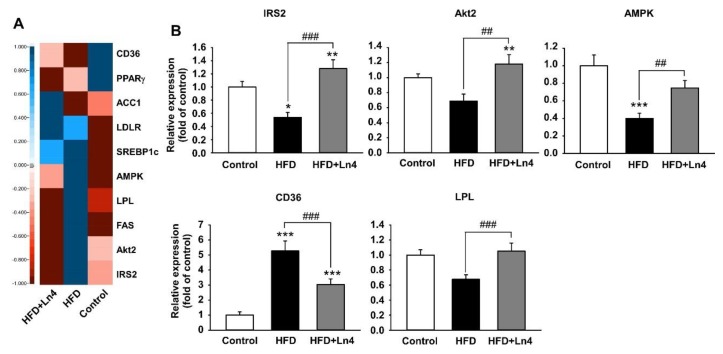
Figure 5.
Effect of Ln4 administration on mRNA levels of hepatic genes associated with glucose and lipid metabolism. (A) Heatmap analysis for qPCR data from liver lysate. Five biological replicates were performed for each group. (B) Statistically significant changes on hepatic mRNA levels related glucose and lipid metabolism are presented by mean ± SEM is presented as mean ± SEM. Quantitative PCR data was tested for statistical difference using one-way ANOVA, followed by Tukey’s test (*, p < 0.05; **, p < 0.01; ***, p < 0.001 vs. Control or ##, p < 0.01; ###, p < 0.001 vs. HFD). PPARγ, peroxisome proliferator-activated receptor gamma; AMPK, AMP-activated protein kinase; CD36, cluster of differentiation 36 or platelet glycoprotein 4; IRS2, insulin receptor substrate 2; LPL, lipoprotein lipase; LDLR, low-density lipoprotein receptor; ACC1, acetyl-CoA carboxylase; FAS, fatty acid synthase; SREBP1c, sterol regulatory element-binding protein 1c; Akt2, protein kinase Bβ.

