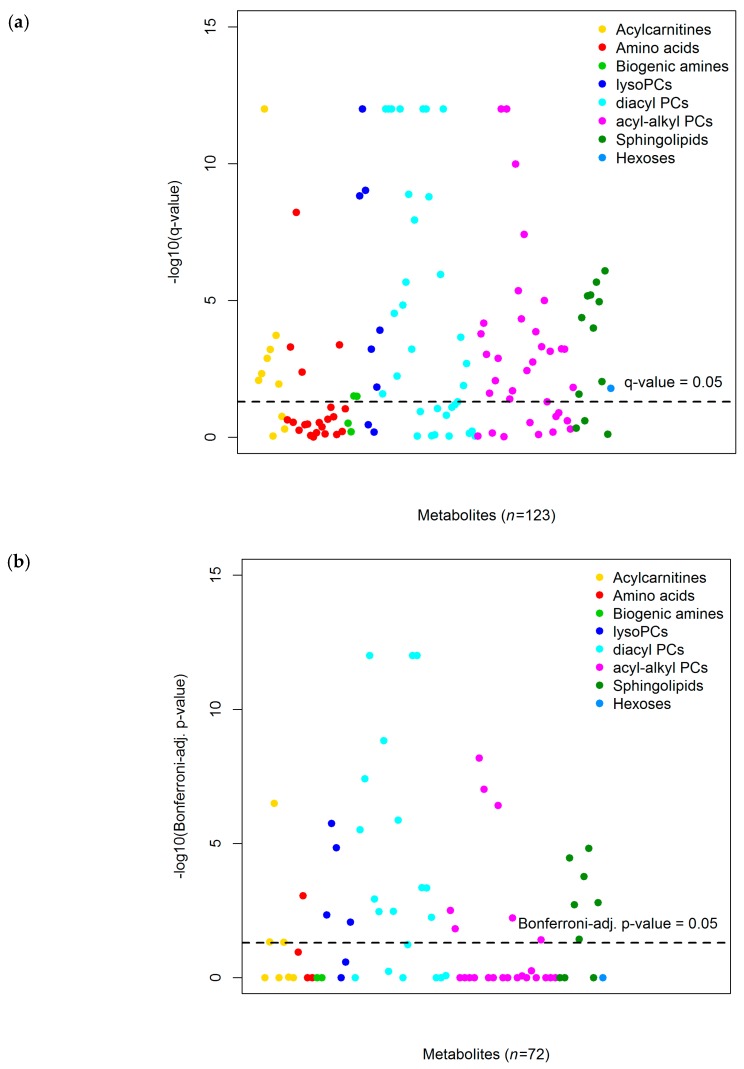
Figure 2.
Manhattan plots showing −log10 of FDR q-values and Bonferroni-adjusted p-values of associations of alcohol intake with metabolites in the (a) discovery (false discovery rate method; n = 1983) and (b) replication analysis (Bonferroni correction; n = 991), respectively. Footnote: Analyzed with multivariable linear regression analyses analyzing associations of alcohol consumption (ln-transformed alcohol intake + 1) as main independent variable and as dependent variables the residuals obtained from linear mixed models with Z-standardized ln-transformed metabolite concentrations as dependent variables, sex as independent variable, and random intercepts for analytical batches nested within studies. Adjusted for: sex; age (y; continuous), body mass index (kg/m2; continuous), self-reported physical activity levels (Cambridge physical activity index [23]: inactive, moderately inactive, moderately active, active, unknown), fasting status (≥6 h, 3–5.9 h, <3 h, unknown), meat intake (g/day; continuous), fish intake (g/day; continuous), energy intake (kcal/day; continuous), country, and smoking status (current, former, never, unknown). The discovery and replication set were taken as random samples without replacement of 66.7% and 33.3% of the total dataset, respectively. Q-values/Bonferroni-adjusted p-values <1.0 × 10⁻¹² (number of decimals above reporting limits of STATA and thus not provided) were set to 1.0 × 10⁻¹².

