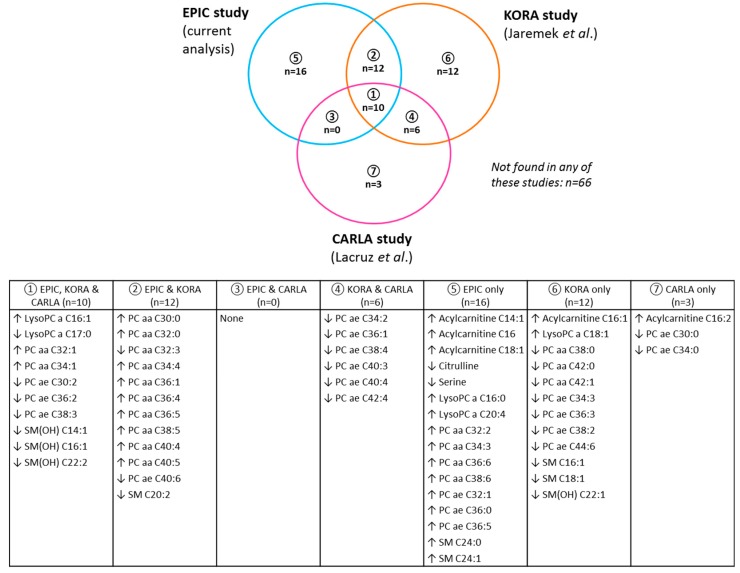
Figure 3.
Venn diagram showing overlap in metabolites identified as significantly associated with alcohol intake after discovery and replication analysis in the current study (EPIC) and those identified by two other previous German population-based studies that were described by Jaremek et al. [9] (KORA study; sex-stratified analysis in 1144 men and 946 women) and Lacruz et al. [10] (CARLA study; combined analysis in 534 men and 496 women), that applied the previous version of the assay used in the current analysis (i.e., BIOCRATES AbsoluteIDQTM p150 kit; p180 kit was used in the current analysis). An upwards arrow indicates a positive association (i.e., higher alcohol intake associated with higher blood concentrations of the metabolite), while a downwards arrow indicates a negative association (i.e., higher alcohol intake associated with lower metabolite concentrations). Footnote: The total number of metabolites (n = 125) is more than those included in the current analysis (n = 123) as two metabolites measured in the KORA and/or CARLA study were not included in the current analysis (acylcarnitine C16:1 and acylcarnitine C16:2; see Table S1). For an explanation of abbreviated metabolite names, see Table S1.

