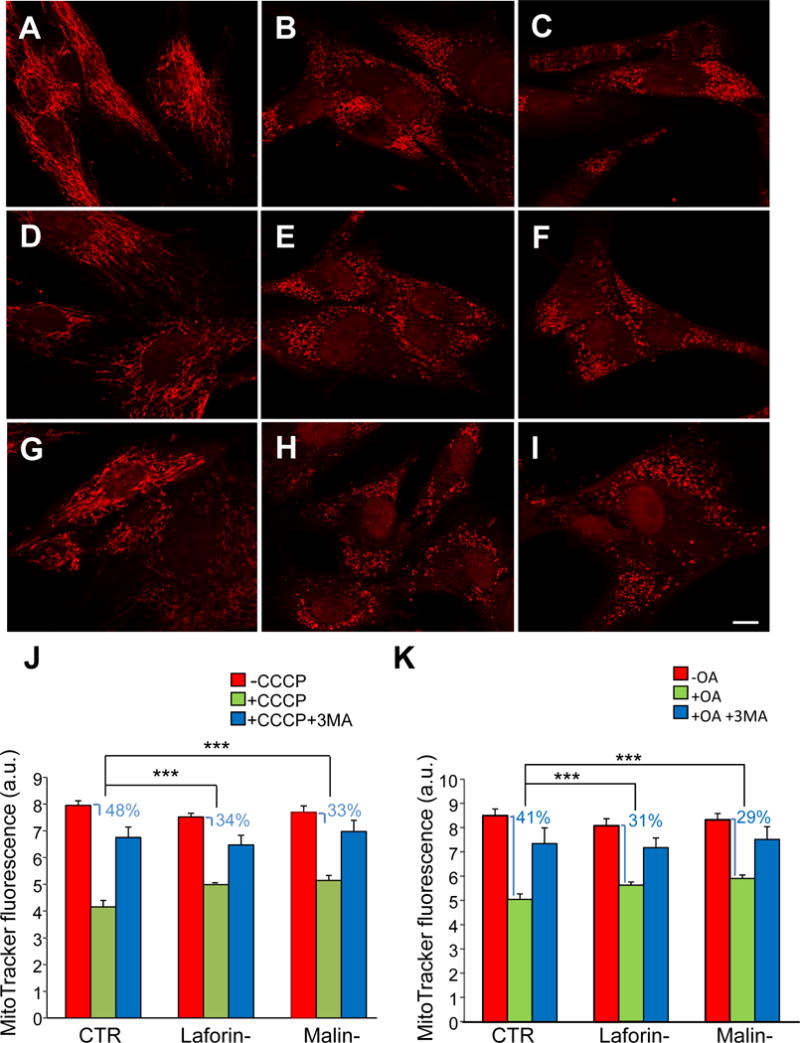
Figure 2. Fluorescence microscopy and analysis by flow cytometry of control and LD fibroblasts stained with MitoTracker Red in the presence or absence of mitochondrial inhibitors/uncouplers.

Fibroblasts from controls (A, B and C) and patients with LD, laforin- (D, E and F) and malin-deficient (G, H and I), were incubated first for 30 min at 37 °C with MitoTracker Red and then for 18 h in full medium without (A, D and G) or with 10 μM CCCP (B, E and H) or 10 μM CCCP plus 10 mM 3-methyladenine (C, F and I). Representative fluorescence microscopy images of control (C-1), laforin- (L-2) and malin-deficient (M-1) fibroblasts are shown (A-I). A slightly lower MitoTracker Red fluorescence was consistently observed in untreated LD fibroblasts (D and G) when compared to controls (A), most probably due to the decrease in mitochondrial membrane potential described by us in fibroblasts from LD patients [17]. Bar: 10 μm. Cells were analysed by flow cytometry (J and K, for CCCP and oligomycin plus antimycin A treatment, respectively) and results expressed as means of arbitrary units (a.u.) and standard deviations from three different experiments. CTR: mean values from C-1 and C2 cells; Laforin-: mean values from L-1 and L-2 cells; Malin-: M-1 cells. Red bars (-CCCP or -OA): untreated cells; green bars (+CCCP or +OA): cells treated with 10 μM CCCP or 10 μM oligomycin and 1 μM antimycin; blue bars (+CCCP+3MA or +OA+3MA): cells treated with 10 μM CCCP or 10 μM oligomycin and 1 μM antimycin plus 10 mM 3-methyladenine. The decrease in fluorescence produced by CCCP or OA is also indicated in percentage. Differences were found to be statistically significant at ***P<0.0001. No significant differences were observed between laforin- and malin-deficient fibroblasts.
