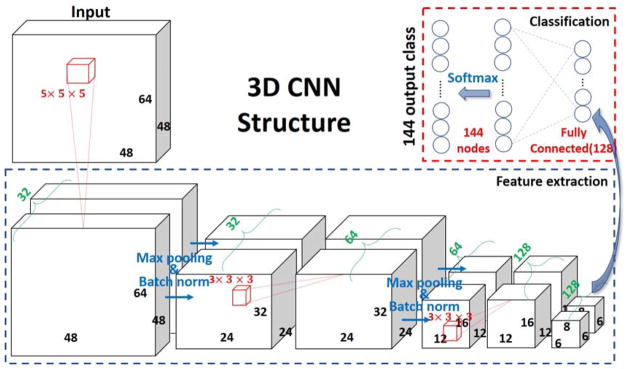
Fig. 1.
3D CNN structure used for training and classification. Bold numbers indicated the feature map sizes (e.g. 48, 64, 48); Red numbers indicated convolutional kernel size (e.g. 3 × 3 × 3) and nodes number of fully connected layers (e.g. 128, 144); Green numbers indicated the channel size of each feature map.

