Fig. 9.
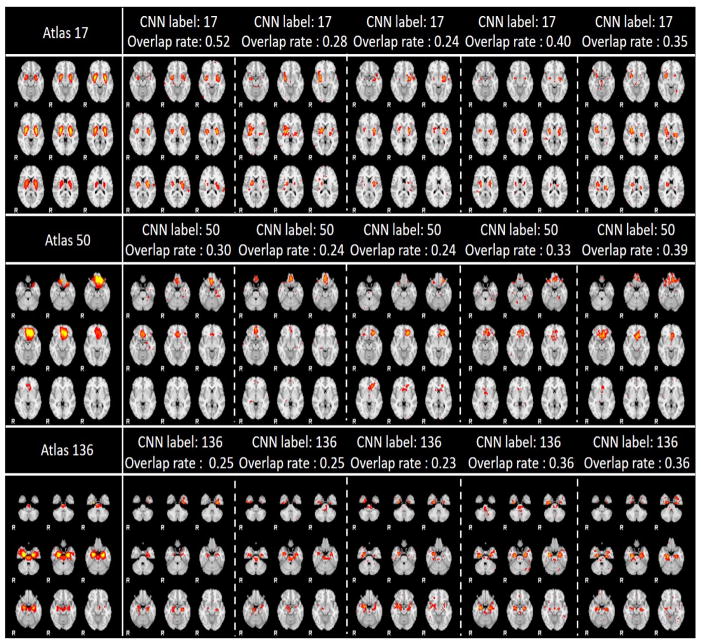
Fig. 9. (a). 3 label predictions with the most data distributions using 5 instances each. Each row contains the atlas picture at the first column, with the rest 5 columns as prediction instances from different individual subjects’ networks.
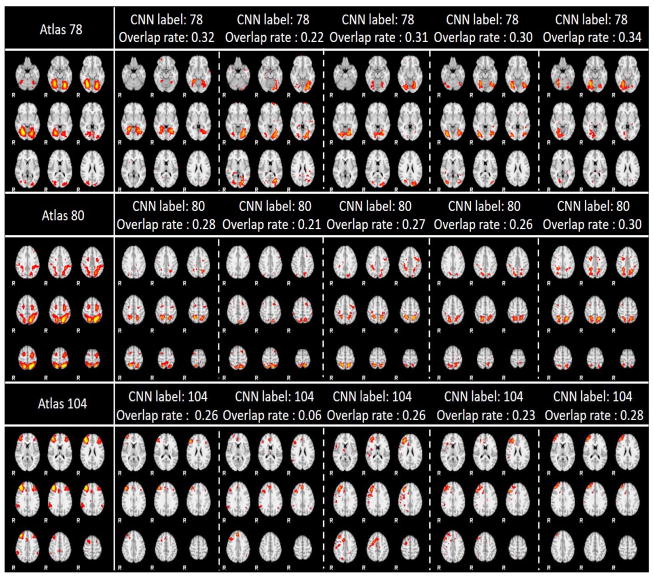
Fig. 9. (b). 3 label predictions with the medium data distributions using 5 instances each. Each row contains the atlas picture at the first column, with the rest 5 columns as prediction instances from different individual subjects’ networks.
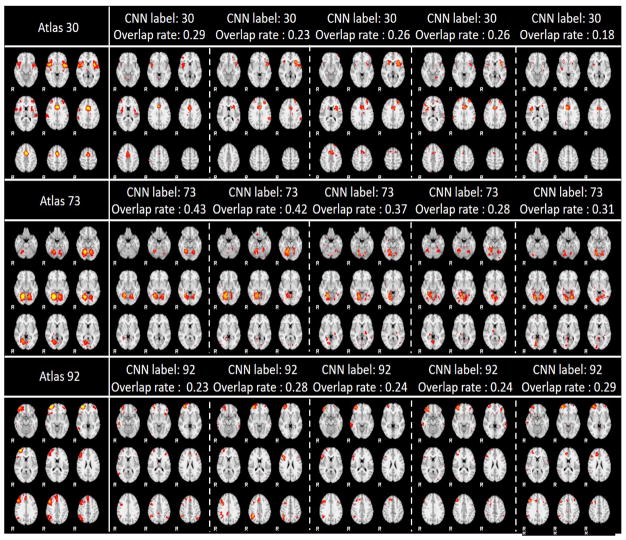
Fig. 9. (c). 3 label predictions with the least data distribution using 5 instances each. Each row contains the atlas picture at the first column, with the rest 5 columns as prediction instances from different individual subjects’ networks.


