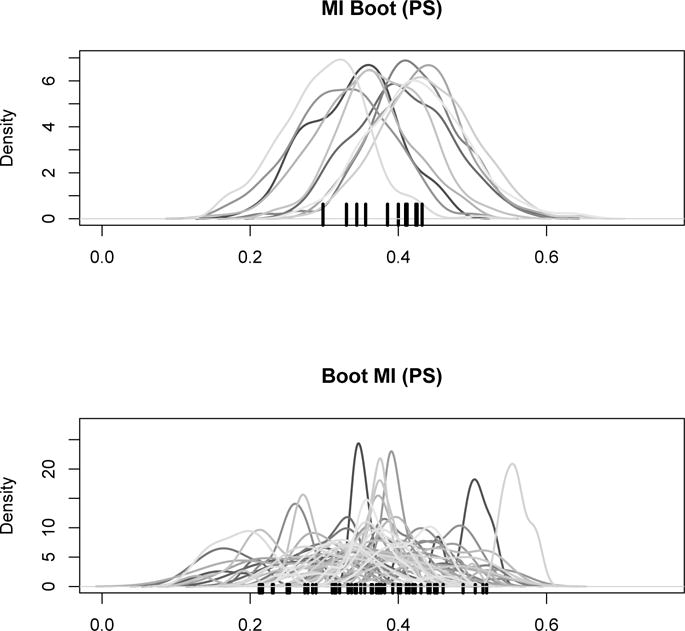
Figure 2.

Estimate of β1 in the first simulation setting, for a random simulation run: distribution of ‘MI Boot (pooled)’ for each imputed dataset (top) and distribution of ‘Boot MI (PS)’ for 50 random bootstrap samples (PS). Point estimates are marked by the black tick marks on the x-axis.
