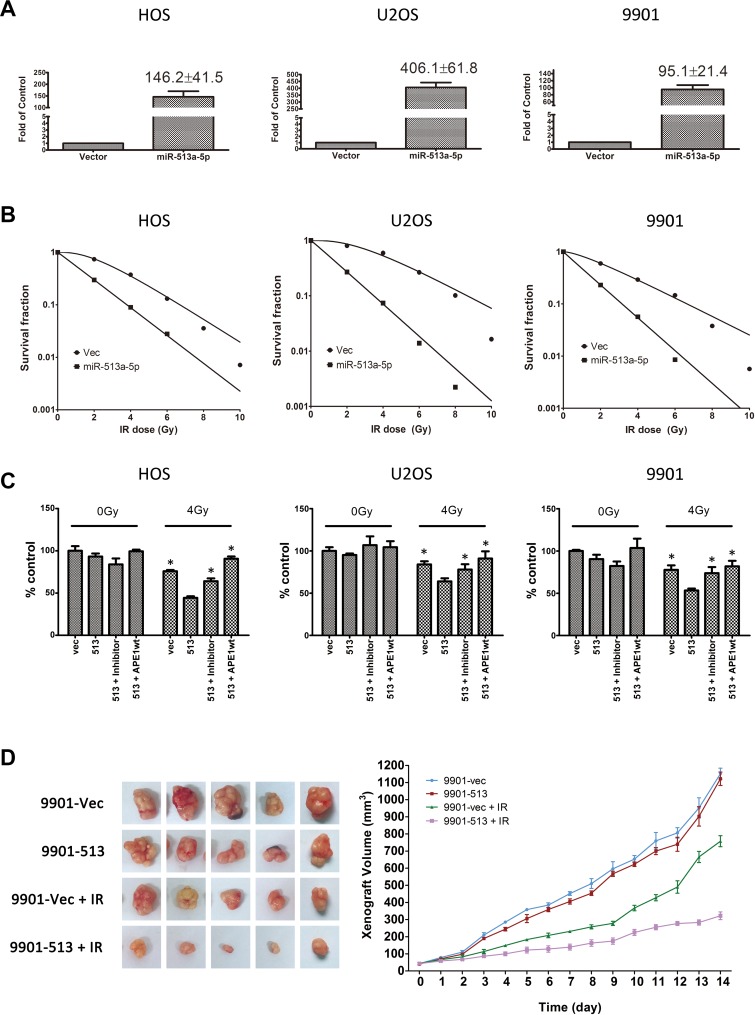
Figure 2. Increasing miR-513a-5p levels induced radiosensitivity of osteosarcoma cells.
(A) The stable expression of miR-513a-5p in osteosarcoma cells and control cells was determined by quantitative RT-PCR and shown in the bar graph. The fold increase is shown at the top of the bar of the miR-513a-5p group. The increase of miR-513a-5p in all three cell lines was statistically significant (p < 0.001). (B) The radiosensitivity of miR-513a-5p expressing HOS, U2OS and 9901 cells was determined by colony formation after 2, 4, 6, 8 and 10 Gy of X-ray irradiation and the detailed D0 and Dq values are shown in Table 2. (C) The overall survival of control (vec), stably-expressed miR-513a-5p cells (513), stably-expressed miR-513a-5p cells treated with miR-513a-5p inhibitors (513+inhibitor) and stably-expressed miR-513a-5p cells transfected with wildtype APE1 expressing vector (513+APE1wt) after 4 Gy X-ray or sham irradiation (0 Gy) were measured by CCK-8 assay. An asterisk (*) indicates that the difference between the marked group and the 513 group is statistically significant (p < 0.01). (D) The tumor growth curve of 9901-vec and 9901-513 cell xenografts post 4 Gy X-ray or sham irradiation is shown. The difference between 9901-vec+IR and 9901-513+IR is significant (p < 0.01).

