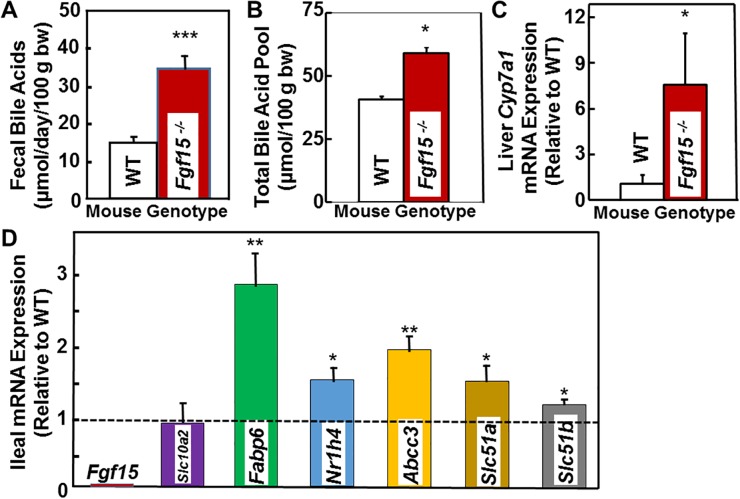
Figure 2. Increased fecal bile acids, total bile acid pool, and expression of hepatic Cyp7a1 and genes related to bile acid transport in FGF15-deficient mice.
(A) Bar graph shows 2.26-fold increase in fecal bile acids levels in FGF15-deficient compared to WT mice (P <0.001). Mean ± SE for five FGF15-deficient and five WT male mice maintained in metabolic cages throughout the three-day stool collection. bw, body weight. (B) Bar graph shows 45% increase in the total bile acid pool in FGF15-deficient compared to WT mice (P <0.05). (C) Bar graph shows changes in hepatic mRNA expression of Cyp7a1, an FGF15 target gene. We determined mRNA expression by Q-PCR analysis (in triplicate), normalized using Gapdh. We expressed data as mean ± SE Cyp7a1 mRNA expression in livers from five FGF15-deficient male mice relative to that measured in livers from three WT male mice (set at 1). (D) Bar graph shows changes in ileal mRNA expression of genes related to bile acid metabolism [Nrih4 encodes the farnesoid X receptor (FXR)] and transport [Slc10a2 encodes ASBT, Fabp6 encodes intestinal bile acid binding protein (IBABP), Abcc3 encodes multidrug resistance associated protein-3 (MRP3), and Slc51a and Slc51b encode organic solute transporters (Ostα and Ostβ), respectively]. We determined mRNA expression by Q-PCR analysis (in triplicate), normalized using Gapdh. We expressed data as mean ± SE ileal mRNA expression for six FGF15-deficient male mice relative to that measured in six WT male mice (set at 1). *P <0.05; **P <0.01; ***P < 0.001.

