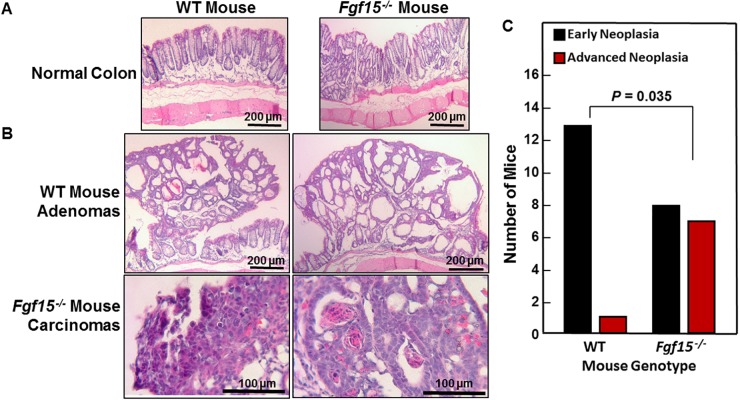
Figure 5. Advanced colon neoplasia in FGF15-deficient mice.
(A) Representative images of normal colons from WT and FGF15-deficient mice. Size bars, 200 μm. (B) Representative images of colon adenomas in two WT mice and adenocarcinomas in two FGF15-deficient mice. Size bars, 200 and 100 μm, respectively. (C) Numbers of WT and FGF15-deficient mice whose colons contained only early neoplasia [aberrant crypt foci (ACF) and/or adenomas] versus those containing advanced neoplasia (high-grade dysplasia and/or adenocarcinoma). The distribution of these lesions in WT versus FGF15-deficient mice was significantly different (P = 0.035, two-tailed Fisher’s exact test).

