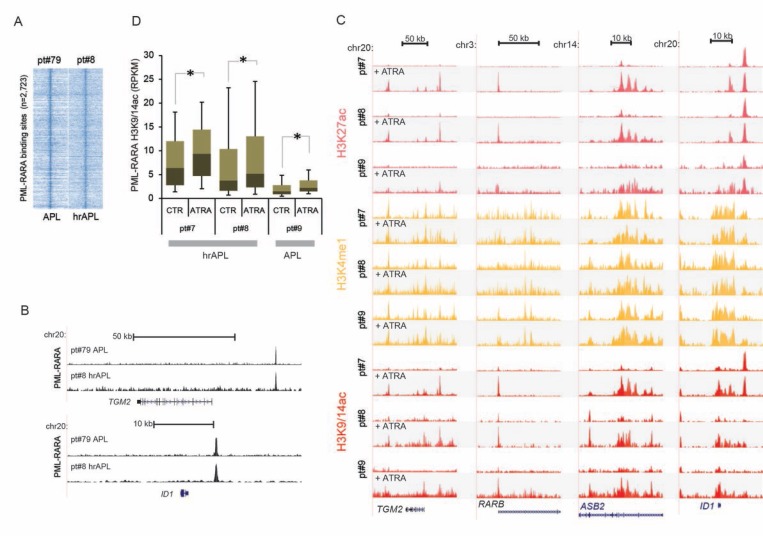
Figure 2. Epigenomic analysis of high-risk APLs (hrAPLs).
(A) Heatmap of PML tag density at PML-RARA binding sites ± 10 kb, after PML ChIP-seq in one APL (pt#79) and one hrAPL (pt#8). (B) Genome browser screenshot of PML ChIP-seq results at the TGM2 and ID1 locus. (C) Overview of APL ChIP-seq (H3K27ac, H3K4me1, H3K9/14ac) data at the genomic regions of the TGM2, RARB, ASB2 and ID1 genes before and after ex vivo ATRA treatment. (D) Boxplot showing changes in H3K9/14ac before and after ex vivo treatment with ATRA at PML-RARA binding sites in one APL and two hrAPLs. * indicates significance at p < 0.01 using the Wilcoxon Signed-Rank test.

