Figure 3.
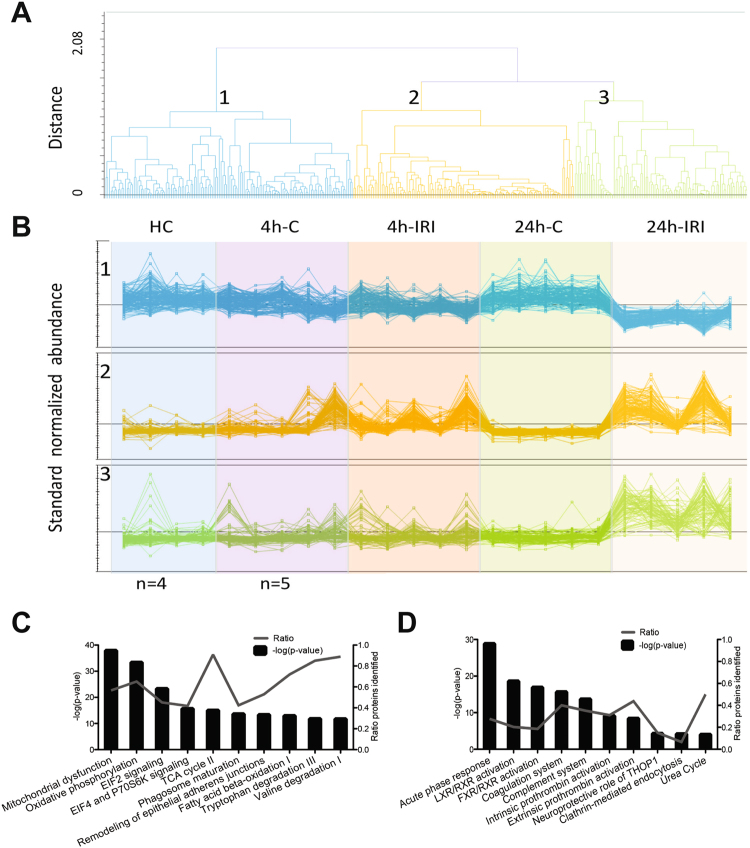
Hierarchical clustering and canonical pathway analysis of the IRI kidney proteome. (A) From all 2798 proteins identified, 363 proteins with a significant change in abundance (ANOVA p < =0.05) between 24 h IRI and 24 h-C were clustered into three groups (1, 2, 3) based on their protein abundance pattern in 4 h-IRI, 24 h-IRI, their endogenous and healthy controls. (B) Abundance profiles of the 363 proteins binned into the three clusters. Cluster 1 shows downregulation of 140 proteins in 24 h-IRI vs other experimental groups. Cluster 2 shows 125 upregulated proteins in 4 h-IRI and 24 h-IRI vs other experimental groups. Cluster 3 shows 98 upregulated proteins in the 24 h/4 h-IRI only. (C) Top 11 canonical pathways revealed by the analysis of all identified 2798 proteins from 4 h IRI/C, 24 h IRI/C and HC. The -log (p-value) for pathway activation is displayed on the left Y-axis, the percentage of identified protein members for each pathway is shown on the right Y-axis. (D) Canonical pathway analysis of the 363 significantly and differentially expressed proteins between 24 h IRI and C. There was no overlap between these top 11 pathways (D) and the top 11 pathways described in (C), indicating enrichment of pathways relevant to alterations of the kidney proteome after IRI. 4 h-IRI and 24 h-IRI: kidneys subjected to IRI; 4 h-C and 24 h-C: contralateral controls; HC: healthy controls.

