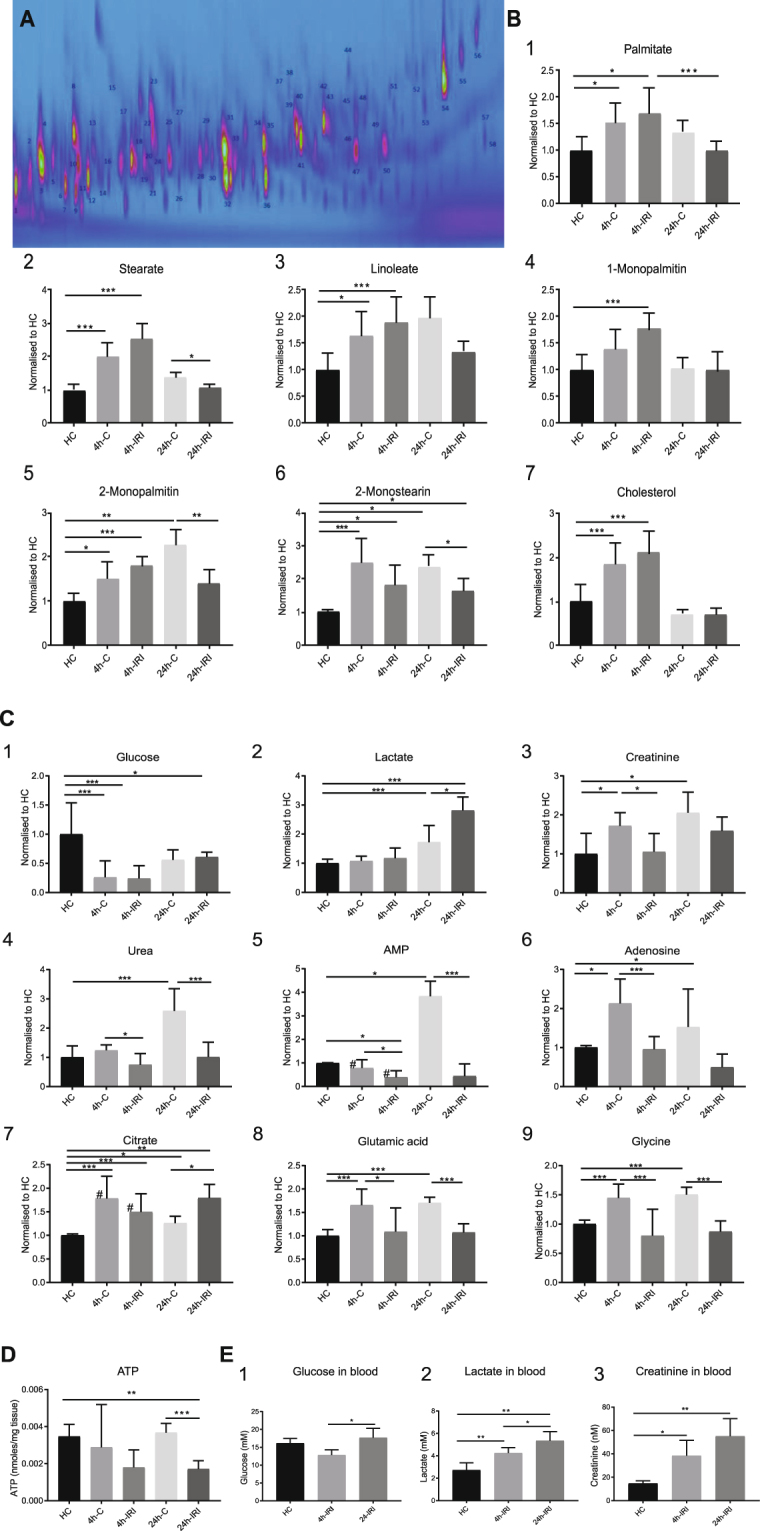
Figure 6.

Metabolites quantified by NMR and GCxGC-MS in both tissue and plasma after IRI. (A) Extracted metabolites were analysed by GCxGC-qMS. A representative 2D-GCxGC map is shown in which the identified metabolites are numbered. (B) Relative quantities of 1. Palmitate, 2. Stearate, 3. Linoleate, 4. 1-monopalmitin, 5. 2-monopalmitin, 6. 2-monostearin, and 7. Cholesterol detected in control (HC), contralateral (4 h-C, 24 h-C and injured kidney tissue (4 h-IRI, 24 h-IRI). (C) Relative quantities of 1. Glucose, 2. Lactate, 3. Creatinine, 4. Urea, 5. AMP, 6. Adenosine, 7. Citrate, 8. Glutamic acid and 9. Glycine detected in control (HC), contralateral (4 h-C, 24 h-C and injured kidney tissue (4 h-IRI, 24 h-IRI). Metabolite levels are provided as detected by GCxGC-qMS, and the values labelled with (#) by 1H-NMR. (D) ATP levels were quantified using a luminescent ATP detection assay kit in kidney tissues (normalized to tissue weight). (E) Metabolites measured using conventional clinical measurement in plasma of HC, 4 h and 24 IRI animals: 1. Glucose, 2. Lactate and 3. Creatinine. Data is presented as mean ± SEM. 4 h-IRI and 24 h-IRI: kidneys subjected to IRI; 4 h-C and 24 h-C: contralateral controls; HC: healthy controls. *p-value < 0.05, **p-value < 0.01, ***p-value < 0.001.
