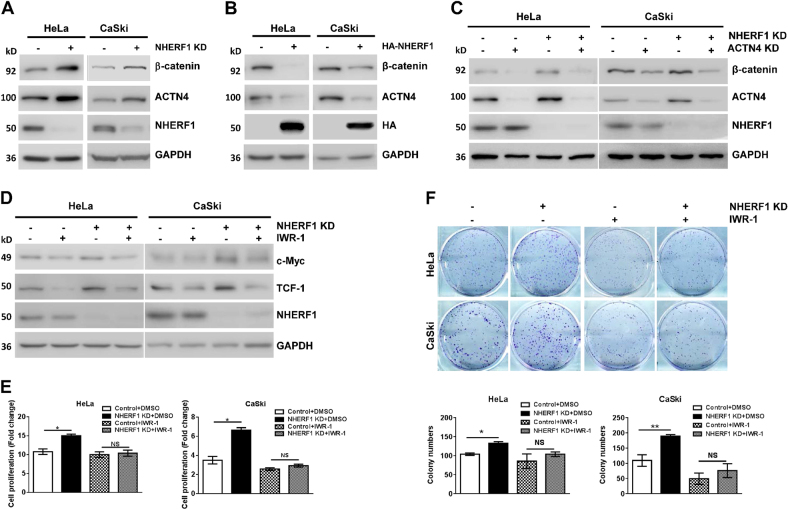
Fig. 4. NHERF1 suppresses proliferation of cervical cancer cells through inhibition of Wnt/β-catenin pathway activation via ACTN4.
a Knockdown of NHERF1 expression increased β-catenin protein level. Cell lysates of HeLa-NHERF1-KD/HeLa-Control or CaSki-NHERF1-KD/CaSki-Control cells were analyzed by western blotting with indicated antibodies. b NHERF1 overexpression reduced β-catenin protein level. HeLa and CaSki cells were transiently transfected with NHERF1 constructs, respectively, and the whole cell lysates were immunoblotted with the indicated antibodies. c Inhibition of β-catenin expression by NHERF1 required ACTN4 expression. HeLa-NHERF1-KD/HeLa-Control or CaSki-NHERF1-KD/CaSki-Control cells were transfected with siRNAs of ACTN4 or control. Cell lysates were analyzed by western blot with indicated antibodies. d Wnt signaling inhibitor abolished NHERF1 inhibition of downstream genes activation of Wnt/β-catenin pathway. HeLa-NHERF1-KD/HeLa-Control or CaSki-NHERF1-KD/CaSki-Control cells were treated with or without IWR-1-endo (IWR-1, 20 μM, 24 h). The cell lysates were subjected to western blot by using specific antibodies. e NHERF1 inhibited cervical cancer cell proliferation through Wnt pathway. HeLa-NHERF1-KD/HeLa-Control and CaSki-NHERF1-KD/CaSki-Control cells were treated in the presence or absence of Wnt inhibitor IWR-1 (20 μM) for 72 h, then the proliferation of cells was assessed by CCK-8 assay. Values were represented as relative value after comparing the absorbance at day 3 with that at day 0 (t test, *p < 0.05, error bars represent mean ± s.d., n = 3). f NHERF1 inhibited the colony formation of cervical cancer cells via Wnt/β-catenin pathway. The clonogenicity of HeLa-NHERF1-KD/HeLa-Control and CaSki-NHERF1-KD/CaSki-Control cells was analyzed by colony formation assay in the presence or absence of Wnt inhibitor, IWR-1 (20 μM for 7 days). Top panel: typical images of cell colonies; bottom panel: quantification of the colony formation efficiency (t test, *p < 0.05, **p < 0.01, error bars represent mean ± s.d., n = 3)

