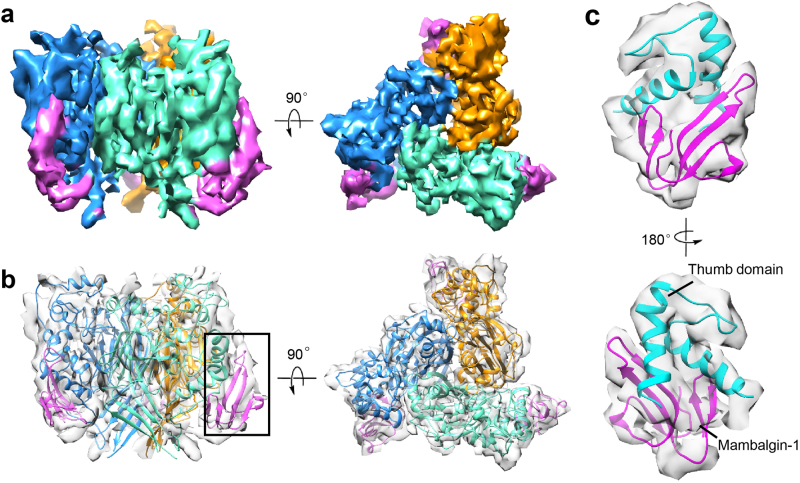
Fig. 2. Cryo-EM structure of the cASIC1aΔNC–mambalgin-1 complex.
a Final 5.4 Å density map of the extracellular part of cASIC1aΔNC-mamabalgin-1 complex in side and top view. The map of each single subunit of cASIC1aΔNC was colored in blue, cyan and yellow respectively, the maps of three mambalgin-1 molecules were colored in magenta. b A poly-alanine atomic model of cASIC1aΔNC–mamabalgin-1 complex superimposed with the cryo-EM map displayed from two views as shown in (a). The model was colored by protein subunit as in (a). c The thumb domain of cASIC1aΔNC and mambalgin-1 were fitted into the cryo-EM map. The cartoon of thumb domain and mambalgin-1 were colored in yellow and magenta respectively

