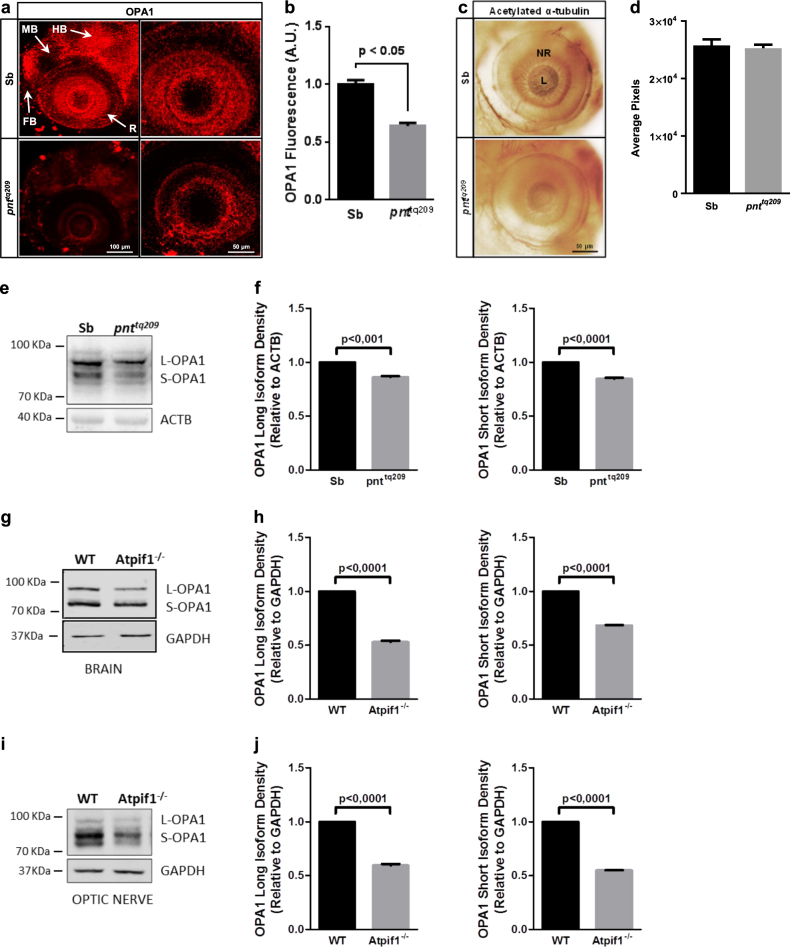
Fig. 3. Atpif1 deficiency causes a decline in the retinal expression of OPA1.
a, b Fluorescent IHC of whole-mount 72 hpf zebrafish, stained with anti-OPA1 antibody. Representative images (a) and quantification of OPA1 fluorescence intensity (b) are reported, showing a reduction in the OPA1 expression levels in the brain and retina of pnttq209 larvae (OPA1 fluorescence (A.U.), Sb: 1.00 ± 0.01, pnttq209: 0.70 ± 0.09; results are presented as mean ± S.E.M. (n = 3)). c, d Analysis of eye morphology in Sb and pnttq209 zebrafish obtained through anti-acetylated α-tubulin IHC of whole-mount 72 hpf zebrafish. No major morphological differences were observed between normal and mutant larvae, as shown in the prototypical images (c) and relative quantification of eye size (d) (eye size (pixels), Sb: 2.58 ± 0.10, pnttq209: 2.53 ± 0.06; results are presented as mean ± S.E.M. (n = 10)). e, f Quantification of OPA1 levels via western blotting analysis in 72 hpf wild type and pnttq209 larvae. The representative membrane blotted for both OPA1 isoform (e) and the bar chart (f) show a significant decrease in the levels of the short isoform of the protein in pnttq209 larvae. g–j (OPA1 band density relative to ACTB, OPA1 long isoform Sb: 1.00 ± 0.01, pnttq209:0.97 ± 0.01; OPA1 short isoform Sb: 1.00 ± 0.01, pnttq209:0.84 ± 0.01; results are presented as mean ± S.E.M. (n = 3), Quantitative western blot analysis of OPA1 levels in the brain (frontal cortex/hippocampus) (j, k) and isolated optic nerve (l, m) of WT and Atpif1−/− mice. Representative blots (j, l) and quantitated band densities relative to GAPDH (k, m) are reported. Significantly lower levels of short and long OPA1 isoforms expression were found in the brain and, specifically, in the optic nerve of mutant mice (OPA1 band density relative to GAPDH, OPA1 long isoform WT: 1.00 ± 0.01, Atpif1−/−: 0.52 ± 0.01 in the frontal cortex/hippocampus; in the optic nerve, WT: 1.00 ± 0.05, Atpif1−/−: 0.59 ± 0.09; in the frontal cortex/hippocampus OPA1 short isoform WT: 1.00 ± 0.01, Atpif1−/−: 0.68 ± 0.01; in the optic nerve, WT: 1.00 ± 0.05, Atpif1−/−: 0.548 ± 0.01; results are presented as mean ± S.E.M. (n = 3). FB forebrain, HB hindbrain, MB midbrain, NR neural retina, L lens

