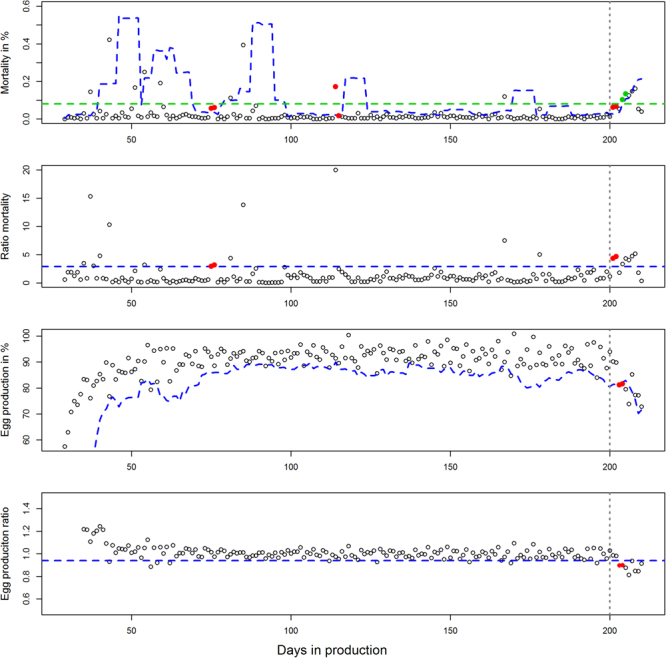
Figure 2.

Application of the different reporting thresholds developed for detection of suspicions of avian influenza outbreaks in layers. The figure shows an example of these thresholds applied for the detection of a low pathogenic outbreak in a commercial layer flock with an indoor (barn) production system. From up to bottom, the first graph shows both the CUSUM-mortality (blue dotted lines) thresholds and the fixed threshold of 0.08% mortality (green dotted line). The second graph shows the ratio-mortality threshold >2.9 (orange dotted line), the third graph shows the CUSUM-egg production thresholds and the fourth (bottom) graph shows the ratio-egg production <0.94 threshold. Points coloured in red or green (first graph marking detection using the fixed mortality threshold) are detected alarms. True alarms are those detected later than day 200 (vertical dotted line) of production.
