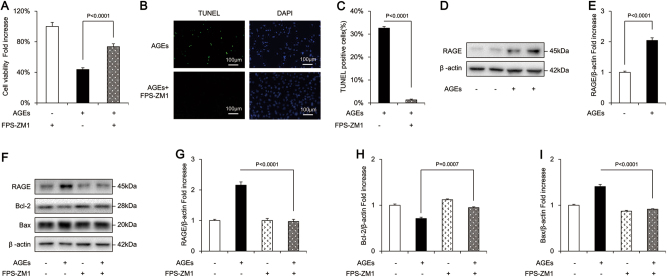
Fig. 5. FPS-ZM1 attenuated AGEs-induced apoptosis in osteoblastic MC3T3-E1 cells.
a Cell viability determined by MTT reduction in osteoblastic cells in the presence of AGEs with or without FPS-ZM1. Error bars indicate SEM (n = 6). b, c TUNEL staining and assay after FPS-ZM1 treatment. Error bars indicate SEM (n = 300). Scale bars = 100 μm. d, f Representative immunoreactive bands for RAGE, Bcl-2, and Bax in osteoblast with (+) or without (−) FPS-ZM1 treatment in the presence of AGES (+) or culture medium (−). Full-length blots are presented in Supplementary Figure 4. e, g, h, i Quantification of immunoreactive bands for RAGE, Bcl-2, and Bax relative to β-actin. Error bars indicate SEM (n = 6)

