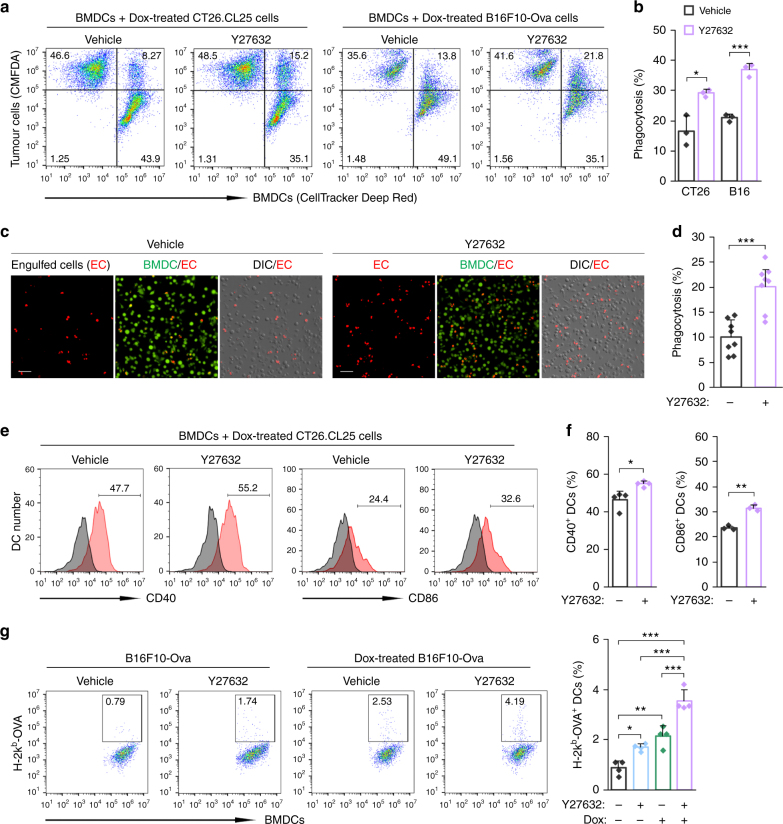
Fig. 5.
ROCK blockade enhances processing of Dox-treated cells. a, b CellTracker Deep Red-labelled BMDCs were co-cultured with CMFDA-stained, Dox-treated CT26.CL25 or B16F10-Ova cells for 5 min, and then analysed by flow cytometry. a Representative flow cytometry plots. Upper right quadrant indicates BMDCs phagocytosing cancer cells. b The percentage of phagocytosis. Data are presented as means ± s.d. (n = 3). c, d CMFDA-labelled BMDCs were co-cultured with pHrodo-labelled CT26.CL25 cells for 5 min in the presence of Y27632 or vehicle, and analysed under a fluorescent microscope. c Representative images of BMDCs phagocytosing pHrodo-labelled, Dox-treated CT26.CL25 cells. CMFDA-labelled BMDCs are shown in green, and engulfed CT26.CL25 cells are shown in red. Scale bar, 50 μm. d Phagocytosis, calculated as the percentage of the total number of BMDCs containing cancer cells. Data are presented as means ± s.d. (n = 8). e, f BMDCs were co-cultured with Dox-treated CT26.CL25 cells for 4 h, and un-engulfed cells were then removed. After further incubation for 20 h, the expressions of CD40 and CD86 in BMDCs were analysed by flow cytometry. e Representative flow cytometry plots. The gray peaks represent the isotype control. f The percentage of CD40+ and CD86+ BMDCs. Data are presented as means ± s.d. (n = 3–4). g BMDCs were pretreated with Y27632 or vehicle and co-cultured with B16F10-Ova cells or Dox-treated B16F10-Ova cells for 4 h and then un-engulfed cells were removed. After further incubation for 20 h, the percentage of H-2kb-OVA+ BMDCs was analysed by flow cytometry using an antibody recognizing a complex of the OVA peptide (SIINFEKL) with H-2kb (MHC-I). Data are presented as means ± s.d. (n = 4). *P < 0.05, **P < 0.01, ***P < 0.001; significance determined by unpaired Student’s t test (b, d, f), or one-way ANOVA with Tukey’s post hoc test (g)

