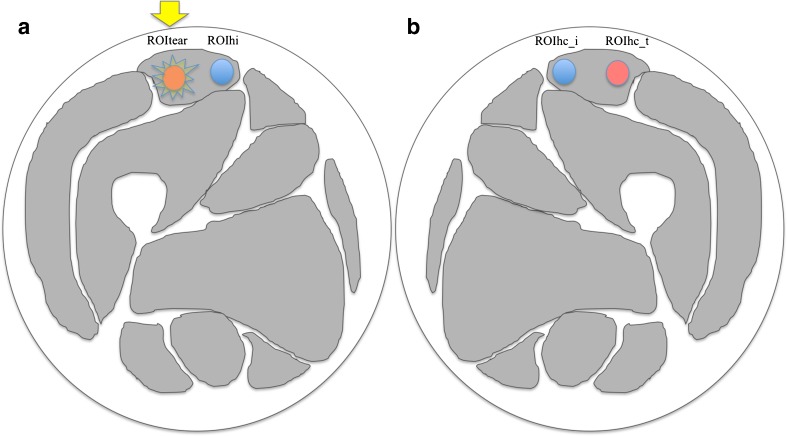
Fig. 1.
Drawing of the muscles of the thigh representing the regions of interest (ROIs) used for the ratio analysis. In this example, an injured area on the right rectus femoris muscle is represented (yellow star) where a manual ROI (red ROI in a, indicated by the yellow arrow) has been drawn (ROItear). The same ROI has been drawn on a healthy ipsilateral area (blue ROI in a; i.e., ROIhi). The same areas were then investigated on the contralateral side (red and blue ROIs in b, respectively ROIhc_t and ROIhc_i)

