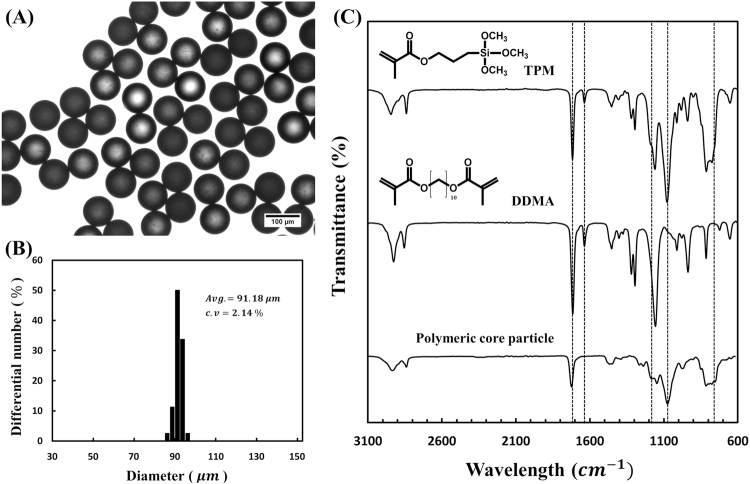
Figure 3.
Optical image, size distribution, and FT-IR spectra of polymeric core particles. (A) Optical microscope image of the polymeric core particles generated by in situ photopolymerization in the microfluidic device. (B) Histograms of the size distribution of polymeric core particles with small variation (CV = 2.14%). (C) FT-IR spectra of 3-(Trimethoxysilyl)propyl methacrylate (TPM), 1,10-decanediol dimethacrylate (DDMA), and polymeric core particles.

