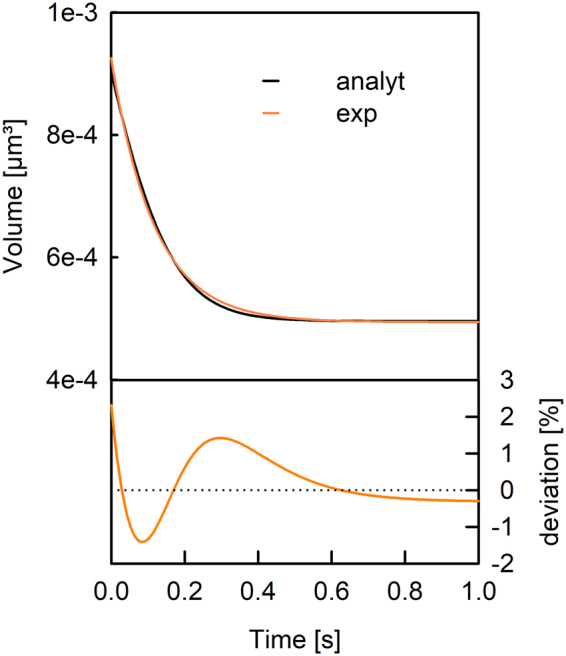
Figure 2.

Comparison of an exponential fit to the analytically calculated decrease in vesicle volume. The fit of an exponential function with initial and final volume as fit parameter (orange line) to the analytical solution (black) of a vesicle with a radius r0 of 60 nm exposed to a hyperosmotic buffer at time zero. The deviation of the exponential fit to the analytical solution is depicted below. An initial inner osmolarity of 200 mOsm, an outer osmolarity of 300 mOsm and a permeability of 20 µm/s are used.
