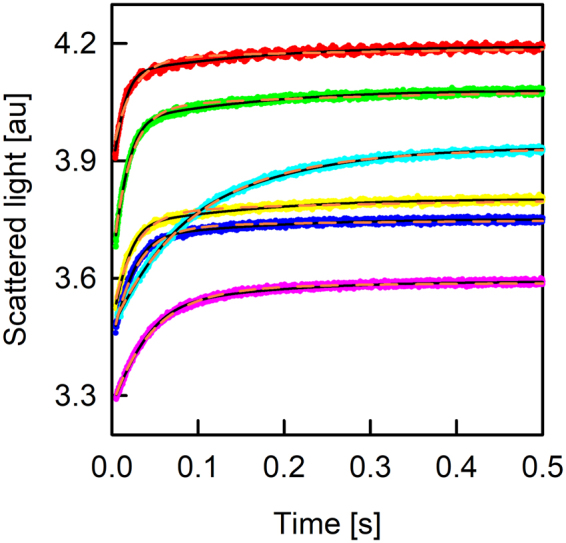
Figure 3.

The osmotic shrinkage of GlpF containing proteoliposomes. Stopped-flow raw data (colored spline lines), fits (black lines) according to Eqs (7) and (8) and exponential fits (orange short dashed) for varying amounts of GlpF (on average number of monomers/PL; 4.5 - red line; 4.1 - green line; 3.5 - yellow line; 2.7 - blue line; 2.0 - pink line; 1.5 - cyan line). Equal volumes of vesicle suspension (100 mM NaCl, 20 mM MOPS, pH 7.5) and hyperosmotic solution (300 mM sucrose, 100 mM NaCl, 20 mM MOPS, pH 7.5) were mixed at 4 °C.
