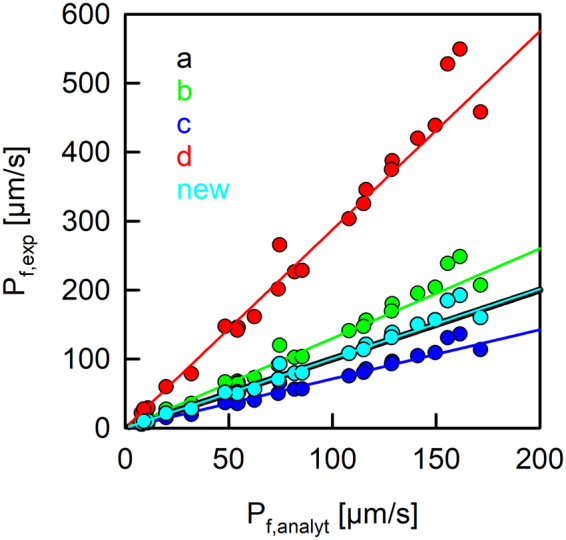
Figure 4.

Correlation of permeabilities obtained from exponential fits, Pf,exp, and the analytical solution, Pf,analyt. Permeability values obtained by the fit of an exponential function to the analytical solution as in Fig. (2) (solid lines) deviate depending on the model used (b: Π = cout−1, green; c: Π = (cout − cin,0)−1, red; d: Π = cin,0·cout−2, blue). Our new relation (new: Π = (cout + cin,0)·(2·cout2)−1, cyan) closely tracks the black line for the analytical solution. Dots represent permeability values obtained by fitting scattering raw data obtained from GlpF containing proteoliposomes (as in Supplementary Fig. S1) either with an exponential fit together with the different approximations (y-data) or with the analytical solution (x-data). The buffer conditions were the same as in Fig. (3).
