Fig. 3.
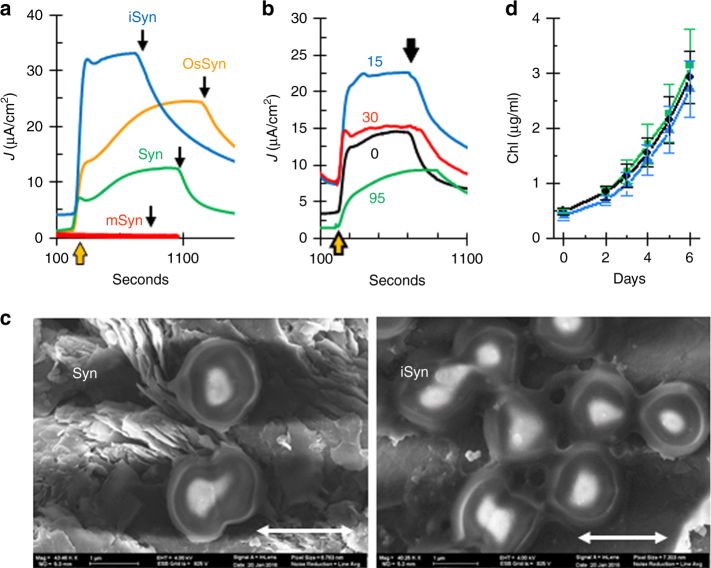
iSyn are living, modified, and clustered cells. a CA measurements of Synechocystis cells (Syn, green), cells undergone a mild osmotic shock treatment, (OsSyn, Orange), cells undergone a gentle pressure treatment (iSyn, blue), and thylakoid membranes (mSyn, red). b CA measurements of cell undergone treatment with microfluidizer at 0, 15, 30, and 95 psi, as indicated in the figure. c SEM image of iSyn (right) and Syn (left) on graphite. Scale bars are 2 μm. d Growth curve of Syn (green), iSyn (black) and iSyn that were illuminated for 30 min in the BEPC (blue) in liquid medium. The vertical lines show the standard deviation (n = 5)

