Fig. 6.
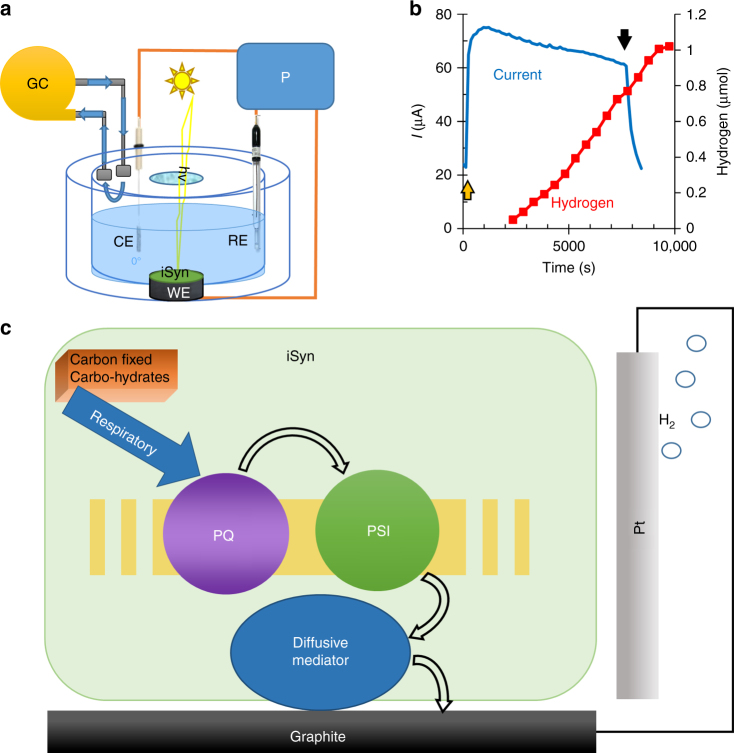
Hydrogen is evolved on the cathode at a lower voltage than in water electrolysis. a Schematic drawing of the working setup for the hydrogen evolution measurements. The CA was measured at 50 mV (vs. Ag/AgCl/3 M NaCl) which corresponds to a voltage of 650 mV between the anode and cathode. b Simultaneous CA measurement of photocurrent (blue) and GC measurement of hydrogen production (red) measured as a function of time for the iSyn at 50 mV (vs. Ag/AgCl/3 M NaCl). c Schematic drawing of the electron flow from carbohydrates (internal or external) via the respiratory, light-driven activity of PSI, and an endogenous diffusive mediator to form hydrogen gas. The multiple electron transfer steps between the PQ and PSI are shown for simplicity as multiple curved arrows

