Figure 2.
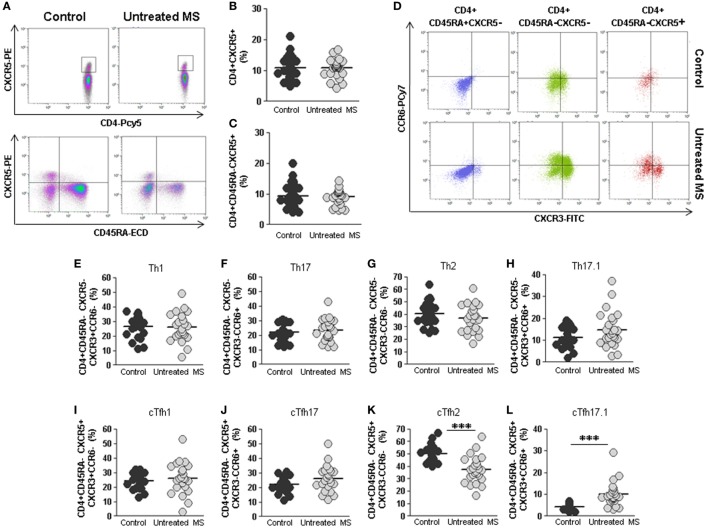
Total cTfh cells and subpopulations of Th and cTfh cells from untreated multiple sclerosis (MS) patients. (A) Density plots of the percentage of total follicular CD4+CXCR5+ (upper plots) and memory follicular CD4+CD45RA−CXCR5+ (lower plots) cells from a representative untreated MS patient (right) and control (left). (B) Percentages of total follicular CD4+CXCR5+ cells from controls (dark gray circles) and untreated MS patients (light gray circles). (C) Percentages of total memory follicular CD4+ CD45RA−CXCR5+ cells from healthy controls (dark gray circles) and untreated MS patients (light gray circles). (D) Dot-plots of the percentage of Th1 CXCR3+CCR6− (lower right quadrant), Th17 CXCR3−CCR6+ (upper left quadrant), Th2 CXCR3−CCR6− (lower left quadrant), and Th17.1 CXCR3+CCR6+ (upper right quadrant) subpopulations on circulating naïve CD4+CD45RA+CXCR5− (left), non-follicular CD4+CD45RA−CXCR5− (middle), and follicular CD4+CD45RA−CXCR5+ (right) cells from a representative untreated MS patient (lower row) and control (upper row). (E–H) Percentages of Th1, Th17, Th2, and Th17.1 non-follicular T cells from controls (dark gray circles) and untreated MS patients (light gray circles). (I–L) Percentages of cTfh1, cTfh17, cTfh2, and cTfh17.1 follicular T cells from controls (dark gray circles) and untreated MS patients (light gray circles). Mann–Whitney U-test p-values: ***p < 0.001.

