
FIGURE 2.
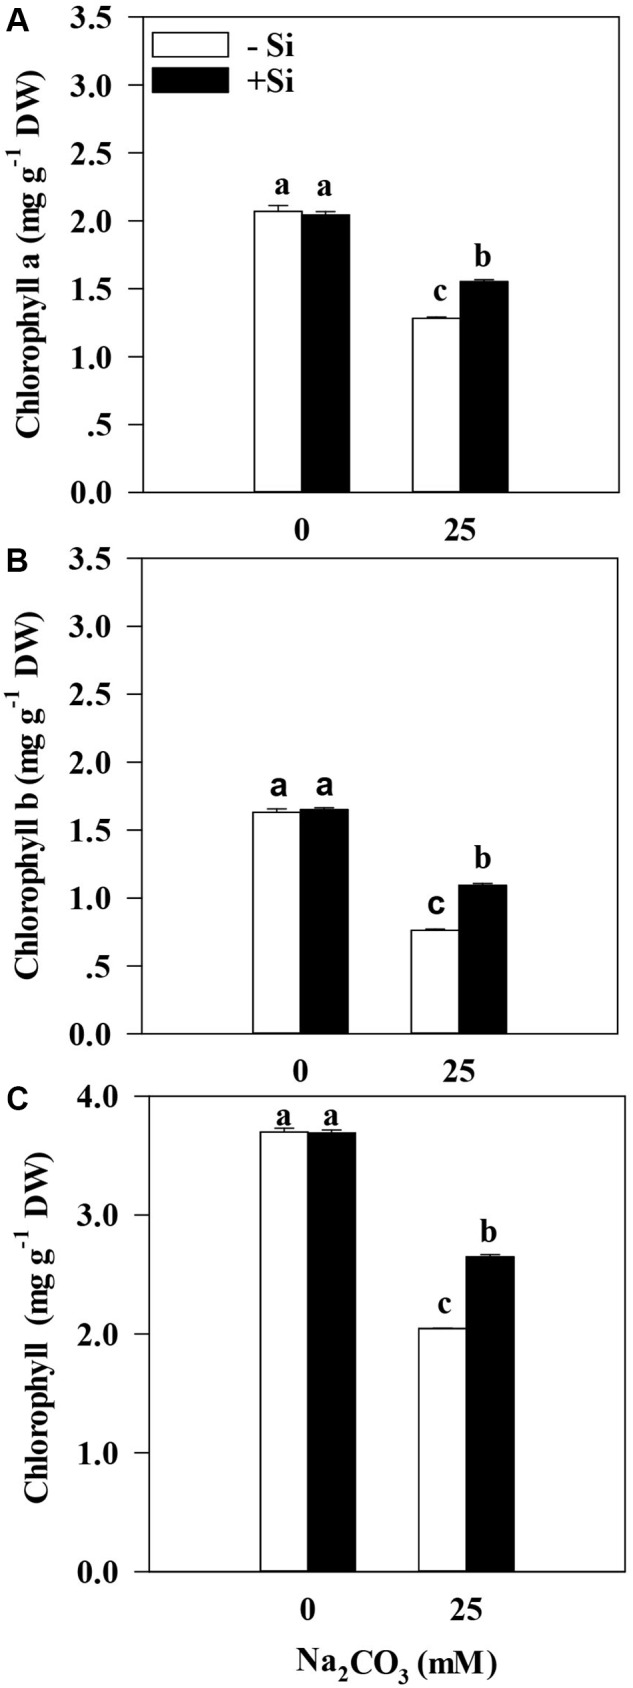
Chlorophyll a content (A), Chlorophyll b content (B), and total chlorophyll content (C) in the leaves of alfalfa seedlings under Si priming in response to alkaline stress. –Si = pretreatment without Si; +Si = pretreatment with Si. Values are means ± SE, n = 25. Different letters denote significant difference (P < 0.05) based on Duncan’s test.