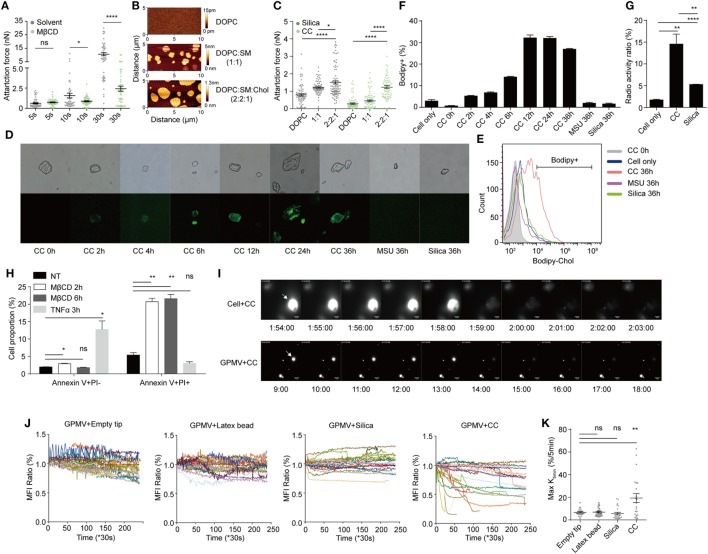
Figure 4.
Cholesterol crystals (CC) extract cholesterol from membrane thus induce signaling free membrane rupture. (A) BMDM membrane cholesterol was depleted by MβCD (4 mg/ml) incubation in serum-free medium for 0.5 h. The attraction force between CC and cells after different contact times was measured by AFM. N = 3. (B) Lipid bilayers with or without cholesterol/SM were produced. The surface of the bilayer was scanned by JPK NanoWizard. The shade of color indicates the height of the surface. (C) The attraction forces between crystal and lipid bilayers were measured by AFM with a contact time of 30 s. N = 3. (D) BMDM were labeled with Bodipy-cholesterol delivered by MβCD and treated with CC (100 µg/ml), MSU (100 µg/ml), or silica (80 µg/ml). After different lengths of incubation at 37°C, cells were lysed and the fluorescence on collected crystals were observed with fluorescence microscope. (E) The collected crystals in (D) were analyzed with FACS. (F) The bar graphs of Bodipy-positive crystals in (E). n = 3. N = 6. (G) BMDM was labeled with cholesterol-[H3] and treated with CC (100 µg/ml), silica (100 µg/ml). 24 h later, cells were lysed and the radioactivity of the collected crystals was detected. n = 4. N = 3. (H) BMDM were treated with MβCD (8 mg/ml) for 2 or 6 h or with TNFα plus CHX for 3 h. Cells were collected and stained with Annexin V and PI. Samples were analyzed by FACS. n = 4. N = 4. (I) Upper: A GFP-expressing BMDM was contacted by a CC constantly. GFP fluorescence of the cell was imaged every 20 s with a 488-nm laser in FITC channel. The pictures show the cell fluorescence around the moment of “explosion.” Numbers below the pictures indicate the time since crystal contact. Lower: a GFP-containing giant plasma-membrane vesicle (GPMV) was contacted by a CC constantly. The rest was identical to the upper panel. The white arrow indicates the crystal-contacted cell or GPMV. (J) Mean fluorescence intensity of GPMV and background was measured with ImageJ. Fold change (compared with initial value) curve of MFIGPMV/MFIBackground during CC and other crystal contact was calculated. Each curve represents a crystal-contacted vesicle. (K) Maximum reduction of normalized MFIGPMV/MFIBackground within 5 min during the contact was manually identified and plotted.

