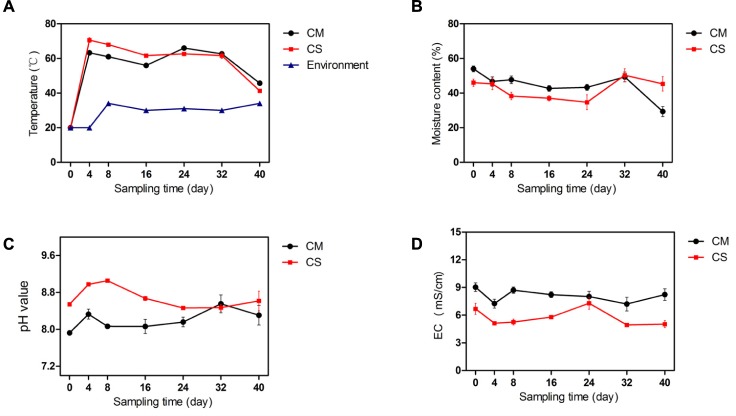
FIGURE 1.
Physicochemical properties of the compost samples. (A–D) show the temperature, moisture content, pH, and EC of compost samples, respectively. The data and error bars are the mean and standard deviation of three subsamples. CM, middle layer (∼20 cm depth) of chicken manure compost. CS, middle layer (∼20 cm depth) of chicken manure compost with added maize straw. Environment, environmental temperature.

