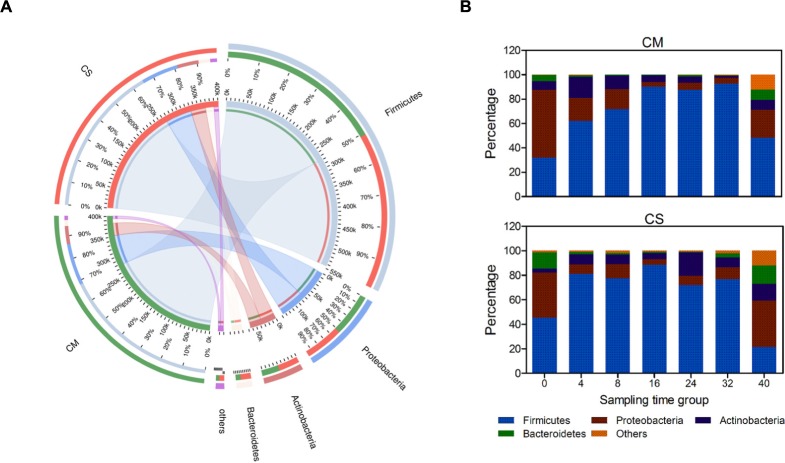
FIGURE 2.
Phylum-level composition of the microbial communities in the compost samples. (A) Co-linear relationship map between samples and species at the phylum level; left semicircles represent composition and abundance of the compost samples, while right semicircles represent distribution proportion of the species in different samples. (B) Color-coded bar plot represents the average abundances of bacterial phyla across different composting times. Species with relative abundance <1% were classified to the category, Others. CM, middle layer (∼20 cm depth) of chicken manure compost. CS, middle layer (∼20 cm depth) of chicken manure compost with added maize straw.

