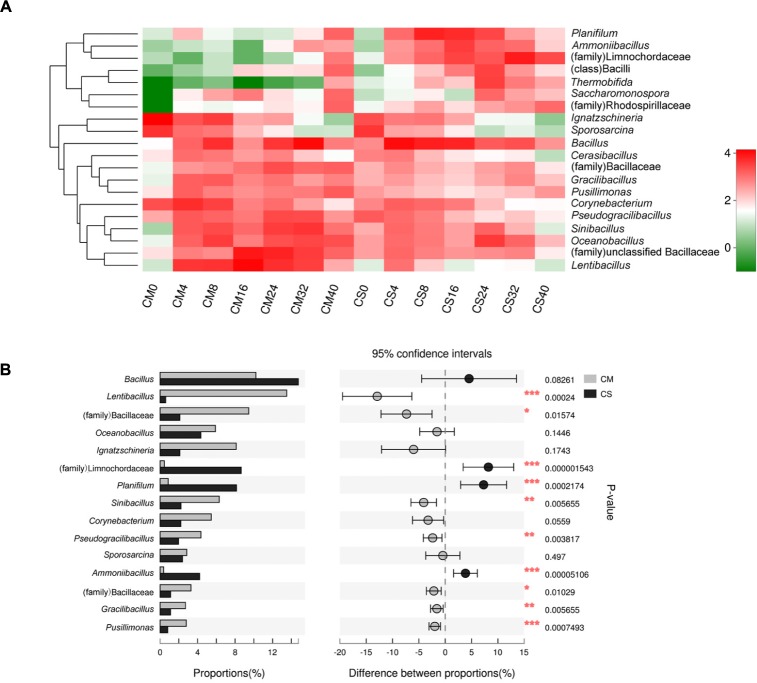
FIGURE 3.
Genus level composition. (A) Heatmap of the dominant genera in the compost samples. The top 20 genera were considered, and the color intensity is proportional to the abundance of each genus. Taxa that could not be classified at the genus level but with an abundance greater than 1% are also displayed at the highest taxonomic level. (B) The different bacterial genus distributions between the two composts. The top 15 genera were considered, and the difference was considered to be significant between the two data sets at p < 0.05 using a t-test analysis, which is indicated by asterisks. CM, middle layer (∼20 cm depth) of chicken manure compost. CS, middle layer (∼20 cm depth) of chicken manure compost with added maize straw.

