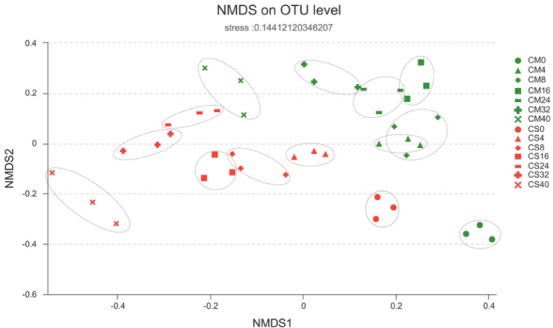
FIGURE 4.

Similarities of the bacterial communities between and within sampling time groups. The distance between samples was calculated by the Bray–Curtis similarity index and plotted with non-metric multidimensional scaling (NMDS), with the OTU similarity set to 0.97. CM, middle layer (∼20 cm depth) of chicken manure compost. CS, middle layer (∼20 cm depth) of chicken manure compost with added maize straw.
